Monthly INsync Chit Chat - July 2023
It’s 99 days until my half marathon, yup, I signed up! A friend and I will be running in Thornbury (up near Collingwood) in early October and now it feels real. Those of you that know me well, know that I’m up for a challenge, and anyone that questions whether I plan to follow through with sufficient conditioning to get this run finished for the first time in about 24 years is mistaken. I also try to get out for walks during the work day, but those hot humid days are challenging for those of us in “work clothes”, because even a leisurely walk pretty nearly requires a shower! But a walk is good for me (probably most of you too!), so I sure can’t complain too loudly.
About 29 years ago, I sold my (first & only) motorcycle and now, all these years later, I’m pretty excited to own a motorcycle again! Yes, I’m being careful and no, it’s not a racing bike! I’m more of a sit back and cruise country roads kind of guy with the wind blowing against me and it is a wonderfully amazing feeling to just be… back in those teenage days, I said that someday I hoped to own a Honda Shadow 1100, and now I do. Why not sneak a photo to show it off! But alright, enough about me, let’s move on…

The News – Headlines
Aspartame to be declared a carcinogen. Canada Bill C-18 mandates that social media companies pay for and share mandated levels of Canadian news and both Facebook and Google say no, and walk away. Canada bank regulator says lenders should urgently take risks from mortgage extensions. U.S. states once awash in cash see their fortunes suddenly reversed. After many rejections from the SEC for a bitcoin ETF, Blockrock expresses interest and will likely gain approval as the institutions fight for their share. Canada fires have burned a south Carolina-sized area of forest. Ireland considering culling 200,000 cattle for climate change. Ontario government plans to allow Grade 11 kids to (drop out of high school) and enter skilled trades full-time to meet labour shortages. Changing amortization, cap on insured mortgages, not the answer to affordability: CMHC. Macron holds crisis talks as hundreds arrested in France riots.
The Bottom Line
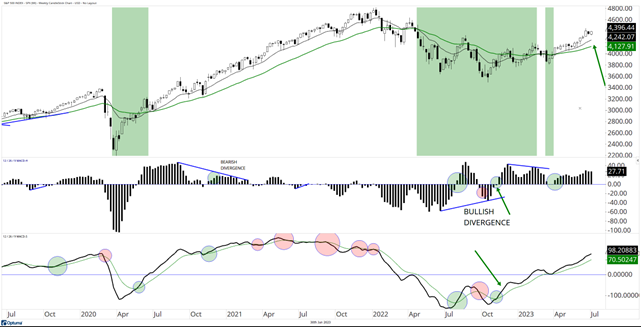
If it looks like an uptrend, it’s an uptrend. Well it (S&P 500) certainly looks like an uptrend, and so as I’ve said for many months now, it’s an uptrend. U.S. stock markets are rising and are in an uptrends. The Canadian market though? Nope. Not an uptrend. There is a difference.
The Bigger Picture
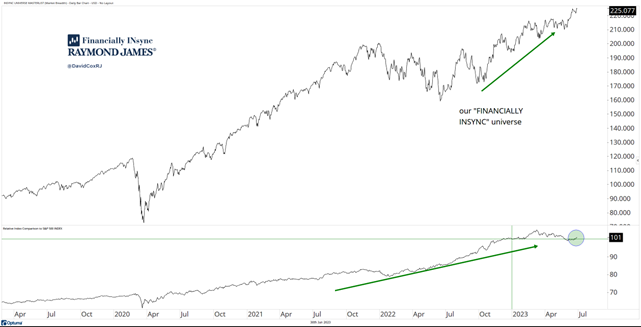
We’ve had more evidence of rotation as I write this and rotation is good! Rotation is healthy! Seeing areas like the industrials sector appear with very robust strength and now the materials sector waking up are more positives for this market. Cruise lines, airlines, specialty retailer stocks are moving and these are economically sensitive sectors and more bullish evidence for the overall bigger picture. The distance between the 13-week average and the 34-week average (green arrow) is growing as evidence that the trend has been strengthening.
Source: Optuma
* as at June 30th, 2023
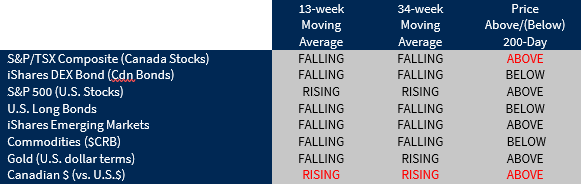
Market Summary
Source: Optuma
* as at June 30th, 2023
** changes from last month are noted in RED text
The U.S. stock market is leading the charge and dominating world markets (except for a few spots like Argentina & Turkey which have been much stronger, for longer). Bonds are weak, commodities are weak and the weakness in interest sensitive stocks all mean weakness for the Toronto stock market which is overweighted in both banks and commodity stocks.
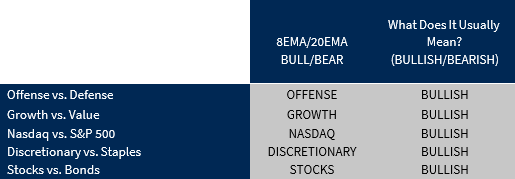
Relatively Speaking (NEW & REVISED!)
Source: Optuma
* as at June 30th, 2023
** changes from last month are noted in RED text
At times, I go about a routine even questioning myself occasionally and this section became one of those spots. Thanks to you Peter, for bringing this back to my attention about what this “Relatively Speaking” section is all about and what its purpose is supposed to be. I’ve updated this with what I consider to be some very important relative relationships, that allow us to compare one thing to another to gauge which is strongest and each pair contributes to understanding the environment for risk-taking. So for example, if stocks are stronger than bonds, it’s a “bullish” piece of evidence for risk-taking. If growth stocks are stronger than value, again, evidence of risk-on type behavior. The five relationships that I’ve shown this month coorborate the story about the current market environment. I hope this makes sense, but by all means don’t ever hesitate to provide feedback and/or call me out on something that just doesn’t seem to be right! Thanks for doing that!
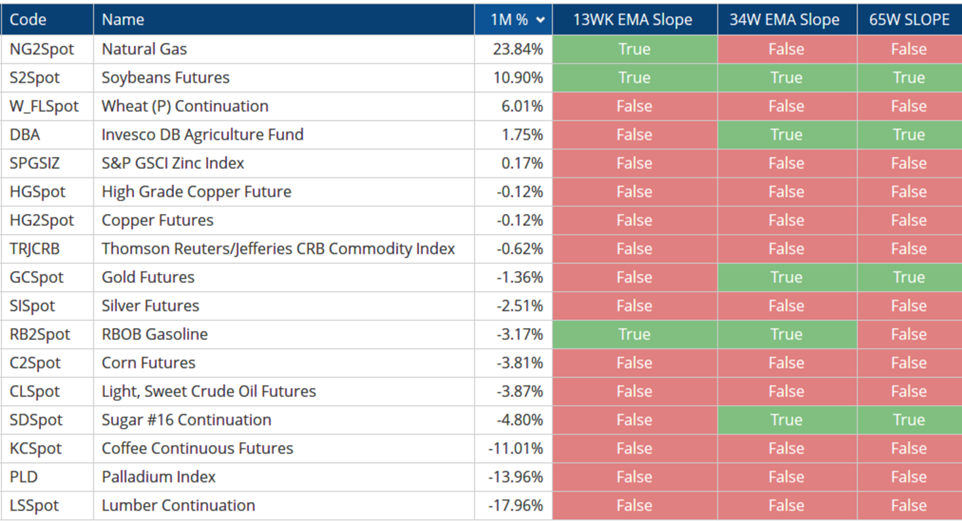
Commodities
For the most part, we still have weak commodities. I don’t see this as a reason to not pay attention, in fact, there are a few technical reasons, I think we should be keeping a close eye on the commodity space. In the last month, natural gas is +23.8%, but that is in the context of a savage -75% crash from its highs last year, so certainly not particularly exciting in bigger picture context. Most of the trends remain down as you can see given the 13-week moving average slopes, the intermediate-term 34-week slopes and the longer-term 65-week slopes are all showing “false” which means falling.
Source: Optuma
* as at June 30th, 2023
Relative Strength Report
Some of the new areas perking up as of late include the airlines, which are from the industrial sector and the cruise lines from the discretionary space. Again, industrials showing strength is bullish, and a more cyclical vote for the market which is trying to look forward to better and perhaps more certain economic times.
Bullish/Strong: Semiconductors, Homebuilders, Greece, Nasdaq, Software, Communications, Technology, Sugar, Growth, Airlines, Robotics
Bearish/Weak: Banks, Clean Energy, Wheat, Mining, China, Copper stocks, Solar, Gold stocks
Our “Financially INsync” Universe
Just like the broader markets, our “Financially INsync” universe is in an uptrend. As the market has experienced more underneath rotation, our universe went through a period of marginal underperformance vs. the market in the past quarter, but has just started to turn upwards again (green circle). This being a quarter-end, we will be re-screening our universe and that is rather exciting! We get to see which stocks meet the rigid screening criteria and which have fallen away. I will of course keep you posted on any notable developments!
Source: Optuma * as at June 30th, 2023
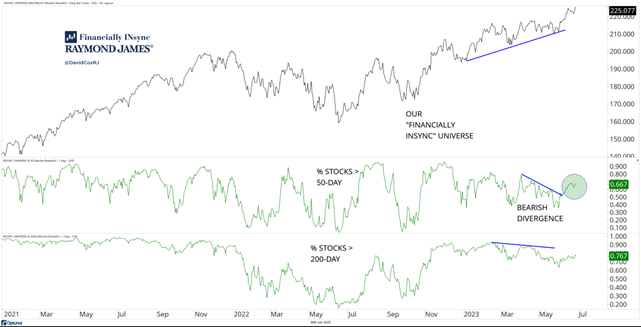
Last month, I showed the breadth deterioration of the #INsync universe with the % stocks > 50-day and % stocks > 200-day deteriorating and offering up a bearish divergence with lower highs, even as the universe itself went higher. But now we’re seeing recovery (green circle below) as some of the stocks that were underperforming like the truckers (part of transports) come back to life. This is a normal and healthy part of stock market behavior. Remember, rotation is good!
Source: Optuma
* as at June 30th, 2023
David’s Contrarian Corner
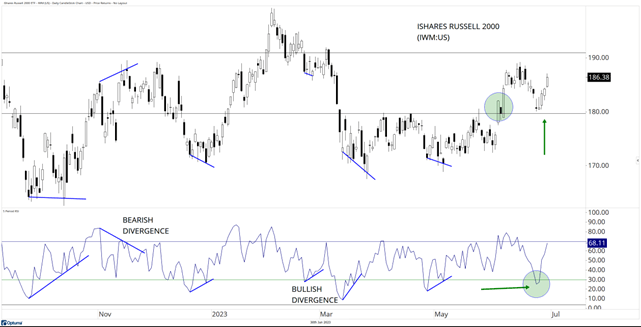
Let’s check in on the small-caps. In early June, we had an impulsive looking move up on volume in the small, mid and micro-cap space, which is evidence of some more broadly based buy programs. In the chart below, you can see that the buying (green circle) occurred as the price of the Russell 2000 (IWM:us) moved out of a multi-month base and went higher. Then, it pulled back in a short-term correction reaching RSI(5) oversold (lower panel) and has now bounced nicely (green arrow). Could this short-term action in recent months turn into an intermediate-term opportunity in small caps? Sure thing. But work to do. First we have to clear those highs from the recent month, and then clear those 2023 highs, so let’s not get ahead of ourselves. But small-caps have been very out of favour, so from a contrarian standpoint I thought deserved some attention.
Source: Optuma
* as at June 30th, 2023
My Hot List
There are growth stocks that are continuing to break out and many are behaving well by not losing those breakout day lows shortly thereafter (which had been commonplace for all of last year). That’s good behavior and evidence can be seen more broadly by seeing the relative strength from all of the ARK funds. It’s worth digging in, checking out some of the constituents in these ETFs and looking for charts that appear to be moving into periods of accumulation and showing overwhelming demand compared with supply that has dried up.
Chart(s) of the Month
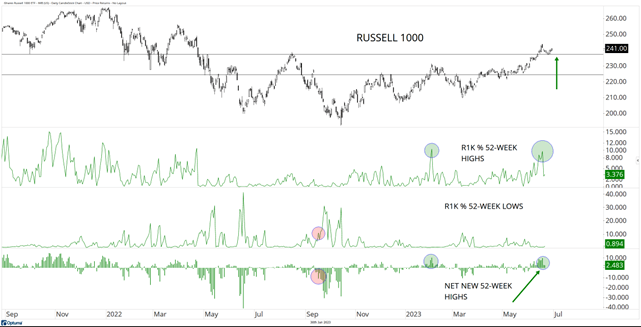
The first chart this month is the Russell 1000, a broad based index with 1000 stocks. In the chart below, we can see the index itself getting back above those summer ’22 highs, and that’s a great technical level that should now offer some support. But underneath, you can see that there are a greater and growing % of stocks hitting new 52-week highs and an absence of stocks hitting 52-week lows. The bottom panel shows the difference between the two and we can simply acknowledge that more highs than lows is bullish and what we want to see as investors.
Source: Optuma
* as at June 30th, 2023
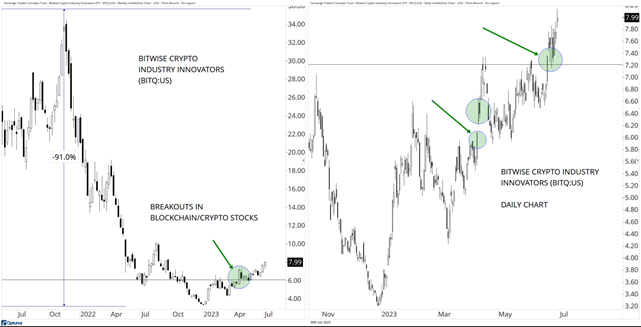
For the second chart, let’s check in on the crypto space via the Bitwise Crypto Innovators (BITQ:us) ETF. Given the strength in the Bitcoin market in 2023, the securities of the various crypto miners have been coming to life and the chart below shows the same ETF, with the weekly chart on the left and the daily chart on the right. I just covered this in the #WhereDoWeStand webinar today (June 30th, 2023), but a weekly breakout is more important than a daily breakout and seeing daily higher highs and higher lows is evidence of the breakout working. I’d encourage us to keep an eye on this space, especially as the likes of Blackrock, Fidelity and other large institutions seek new approvals for ETFs and ways to introduce their institutional friends and clients.
Source: Optuma
* as at June 30th, 2023
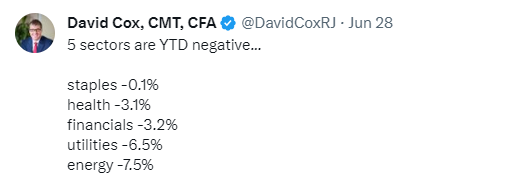
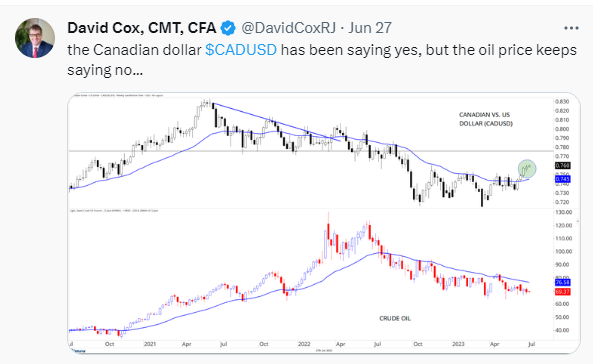
Social Media Corner
As Elon calls it, Twitter is the town hall and I’m glad to be part of the discussion, mostly of course related to investment markets and if you still haven’t tried it out, go for it! Point yourself over to @DavidCoxRJ and give it a try!
Upcoming Dates, Seminars, and Announcements
It’s summer time! There are a few holidays planned by all of us on the “Financially INsync” team but our clients always know that the ship is manned at all times and despite the current optimistic environment, complacency never has room on our team, spring, summer, fall or winter!
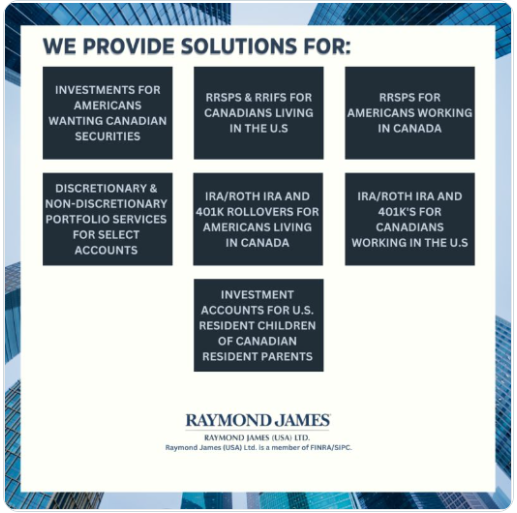
We have been familiarizing ourselves with the U.S. system via RJLU and have some new clients being onboarded – welcome! If you are someone who finds themselves in any of these circumstances and wonder if we would be of assistance, please ask!
Lastly, if you are interested in attending our upcoming webinar entitled “Is Canada Safe for Investors?”, please join us next week!
Online WEBINAR: “Is Canada Safe For Investors?”
https://attendee.gotowebinar.com/register/7254641923749715802
Thursday, July 6th at 12 NOON EST (12-12:45pm)
Enjoy the summer weather! Your feedback, questions and/or comments are always welcome…
Sincerely,
David Cox, CFA, CMT, FMA, FCSI, BMath
Senior Portfolio Manager, Wealth Advisor
Raymond James Ltd.
Phone: 519.883.6031
Unit 1 – 595 Parkside Drive | Waterloo, ON | N2L 0C7
david.cox@raymondjames.ca
www.financiallyinsync.com
![]() @DavidCoxRJ
@DavidCoxRJ