Monthly INsync Chit Chat - September 2023
I was in Algonquin Park for our annual backcountry trip last week with my youngest son Emry (12, but 13 this week) and it’s always an adventure and a fun opportunity! Years ago, it was the three boys, then two boys and now with jobs and other activities for the older ones, it was Emry and I who ventured. We were 4 lakes in, on Daisy Lake up past Kearney and we managed to get a site on the island, which was beautiful! Swimming, fishing and relaxing were all easy to do. But our backcountry tent (which is more than 20 years old) leaked in an all-night rain fest and I was rather discouraged to see how much water, and puddles came in – soaking us and our contents. At least it was cool and overcast the next day (not!). I suppose like most products we buy these days, a new backcountry tent won’t last 20 years this time, but what do you do!
September of course means back to school and the start of a new schedule of activities which this year is likely to include: music lessons, basketball, Bible quizzing, gymnastics, Youth and Friday afternoon Puck Hogs hockey! Part of the kids growing up and I sure don’t mind shuttling them around and think that physical activity and social camaraderie are all important for their development.
The News – Headlines
So much of the news continues to be rather wild if you choose to dig in, particularly if you go deeper than the government funded state media that exist in Canada and the U.S. TD Bank reports that 48% of mortgages have an amortization period more than 25 years (the Canadian standard for decades). Undercounting of an estimated million non-permanent residents (in Canada) could affect per-capita GDP, say economists. Public Square bursts onto the scene (and IPO’d) with 65,000 businesses signed up, all desiring to serve their customers and not push their political or ideological and woke beliefs on customers. Cellphones have taken over our schools, and it’s been a disaster for our kids. Goldman cuts U.S. recession chances to 15% on improved inflation. The U.S. government offers $700/per household to those who have lost their home in the Lahaina fire, and then spends millions of dollars putting up a tall black fence that runs the entire length of the fire zone preventing access and/or eyeballs from looking inside. Drones from journalists were also banned. Meanwhile, there are reports that up to 2,000 children in Hawaii are missing. Hawaii Electric chooses to remove power lines that were damaged before investigators arrived, which also appears curious.
The Bottom Line
The U.S. market continues in its big picture uptrend, turning upwards in the last week of August after a short-term correction.
The Bigger Picture
The weekly S&P 500 chart (below) shows higher highs and higher lows and while the MACD remains negative, it ticked up again, evidence of buying demand after the latest short-term correction this summer. September seasonals are typically weak and could provide ongoing and short-term challenges, but those challenges aside, the big picture uptrend is an uptrend.

Market Summary
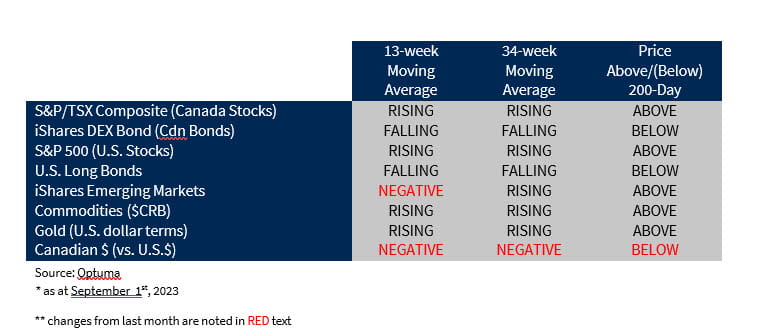
Some consistency this month as stocks continued to rise as 13 and 34-week averages are moving higher for both stocks and commodities. Bonds continue to struggle as the persistently high yields attract too few buyers to push bond prices higher. This has led to pronounced weakness in some areas of the market like utilities, dividends and real estate, all of which has been insufficient to shift the behaviour of broad equity markets.
Relatively Speaking (NEW & REVISED!)
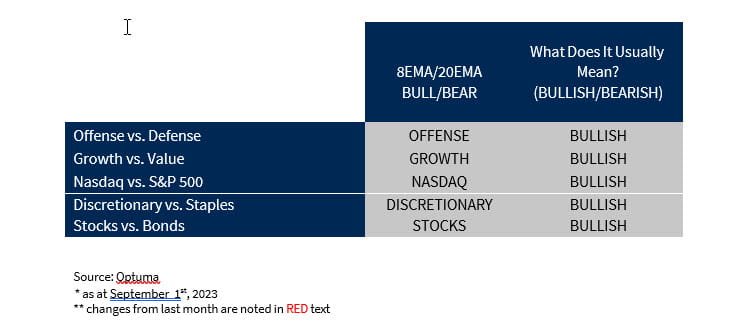
Nothing new to report here. Growth and offense continue to dominate and it’s the defensive consumer staples, utilities and dividend/”blue-chip” investors that are struggling relatively. All we try to do is observe price behaviour and the relative preference for risk assets and accept
that the market is more knowledgeable than we are. Seeing higher beta and growth assets outperform is NOT what we’d expect to see if the stock market was weakening and/or topping (much to the chagrin of the bears).
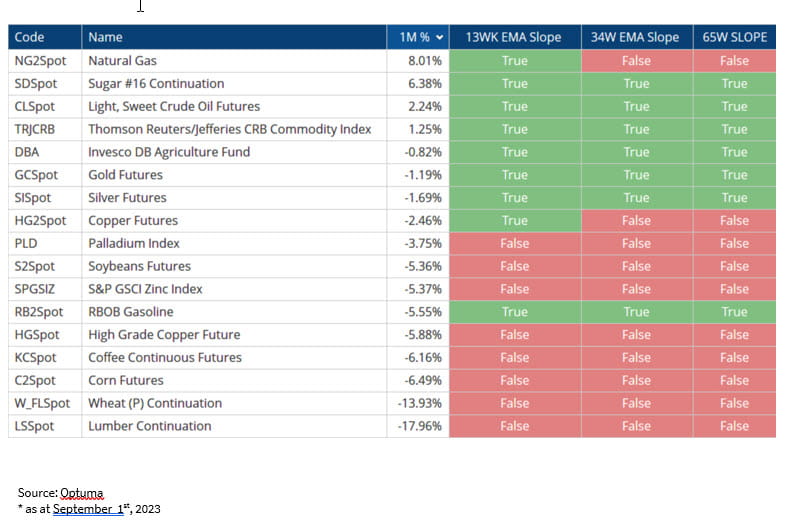
Commodities
Commodities are rising and increasingly so, as oil has led the way, breaking above the $83-$84 prior highs resistance and embarking in a new uptrend. Energy stocks led the way, so investors seemed to have expected this. This of course might cause problems for the inflation weary folks, like governments and central banks trying to help out the struggling borrowers (governments, companies AND average people) with a permanent and new refrain from higher interest rates, but the markets will dictate the demand and supply and we all have to accept it. With so many millions of Canadians reportedly using the Food Bank on a regular basis, I’d say, we have a serious crisis on our hands. Rising commodity prices will exacerbate these issues in my opinion.
Relative Strength Report
As higher beta growth outperforms, we continue to see stocks like semiconductors, cloud computing, cyber security and software hang out at the top of the relative strength lists. Throw in some energy stocks for good measure and we have the hot spots in today’s market. Solar, utility and bond investors are struggling as those weak down trends, that have existed for some time now, continue.
Bullish/Strong: Semiconductors, Homebuilders, Energy stocks, Oil, Uranium, Cloud Computing, Greece, Nasdaq, Software, Argentina, Cyber Security
Bearish/Weak: Wheat, Corn, Solar, Utilities, Bonds, Inverse Funds
Our “Financially INsync” Universe
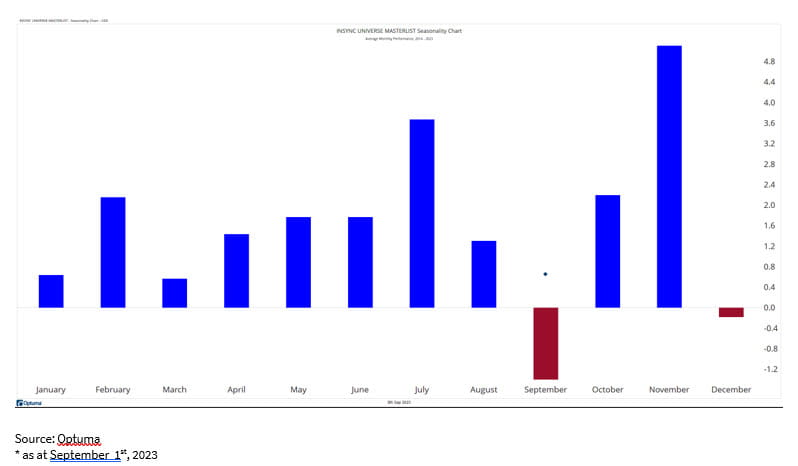
The “Financially INsync” universe is a quantitatively screened basket of large-cap securities that trade on the U.S. and/or Canadian markets. Stocks must have outperformed the S&P 500 on a 1, 2, 3, 4, 5, and 10-year time frame for inclusion and the universe is screened once each quarter. It is not a model portfolio, nor is it investable, but our team uses it to better understand a segment of the market that has provided strong market relative returns in an effort to have a market pulse on the risk-taking environment that we face as investors. This quarter, the universe includes 105 stocks and you can see from the seasonal chart below that that doesn’t make them typically immune to September. Stocks are often weak and the long-term consistently outperforming stocks are not the exception. Let’s see what happens.
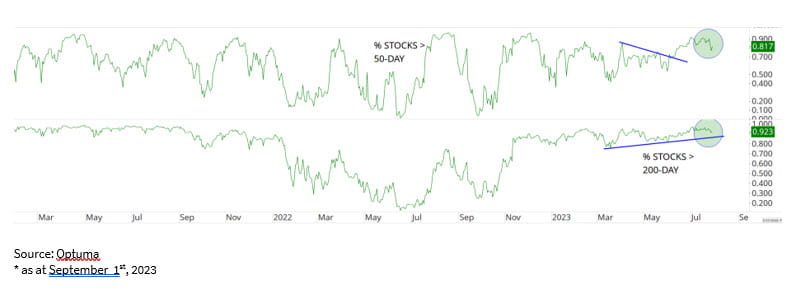
We can see from the second chart, that we continue to have healthy breadth within the #INsyncUniverse basket with 81.7% of the 105 stocks > 50-day moving average and more than 92% of them above the 200-day moving average. That’s healthy. When strong stocks start to weaken, we can question the market, but for now, that is not the case.
David’s Contrarian Corner
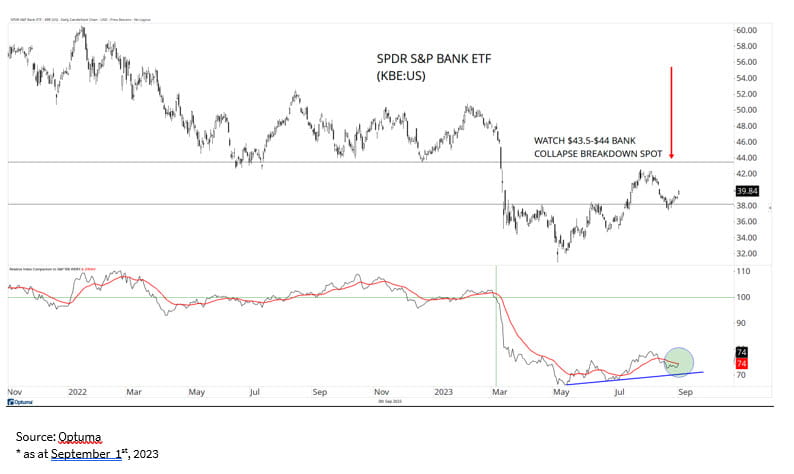
U.S. bank stocks. Really? The SPDR Bank ETF (KBE:us) gapped down and broke down as bank failures happened early in 2023 but are showing some signs of recovery. On the very right-hand side of the chart (below), we can see higher highs and higher lows, and in the bottom panel we can even see the same uptrend taking place relative to the S&P 500. What does that mean? U.S. bank stocks are outperforming this summer. But can the KBE break back above that prior breakdown spot? Let’s keep an eye. Should this occur, it would be another strong vote for the market. But again, not a prediction or a forecast, just an observation and something that is typically viewed as somewhat important by the market. And with a contrarian hat on, we’d of course have to agree that few are interested and/or perceive opportunity in these stocks.
My Hot List
Energy stocks came back to life somewhat quietly, one or two at first, with the services stocks leading the way, and now we’ve seen regular additions to the relative strength lists and I think that because we’ve now seen crude oil follow through and push back to the high $80s and break into a new uptrend, let’s not dismiss these stocks and you can bet we’ll be eyeing pullbacks carefully. Worth mentioning is uranium stocks which showed up relatively, in advance of the broader oil & gas sector, and also deserve a spot on your radar.
Chart(s) of the Month
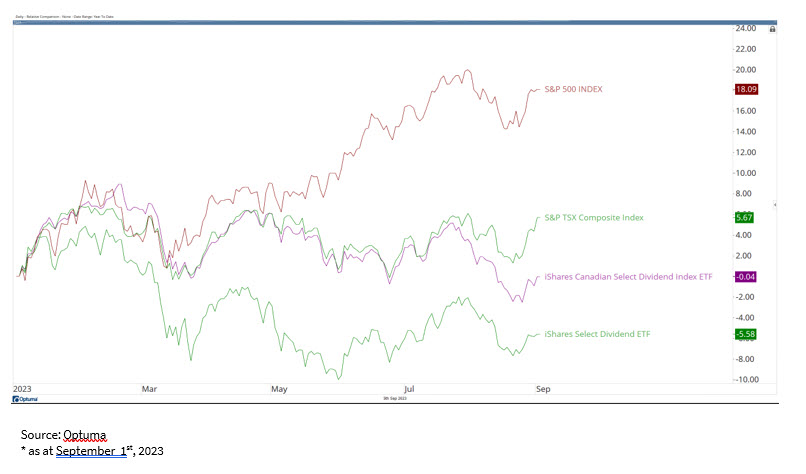
For the first chart of the month, let’s look at the S&P 500 and S&P/TSX stock markets on a year-to-date basis and alongside, we’ll plot a couple of the key dividend stock ETFs. What do you see? What you see is that TSX dividend stocks (XDV:TSX) have underperformed the stock market, and U.S. dividend stocks ($DVY) have too (much more significantly I might add!) – this makes sense given the interest rate environment, and I can’t emphasize this enough. Interest rates and yields appear to me to be in very long-term new uptrends (generational type new uptrends!), and so expecting them to fall back to zero any time soon seems rather far fetched and highly unlikely. So we’re seeing dividend stocks continue to be re-priced as investors can take advantage of the “risk-free” rates of things like short-term T-bills and GICs that offer pretty juicy yields without the price risk of the underlying and often held dividend stocks by income investors.
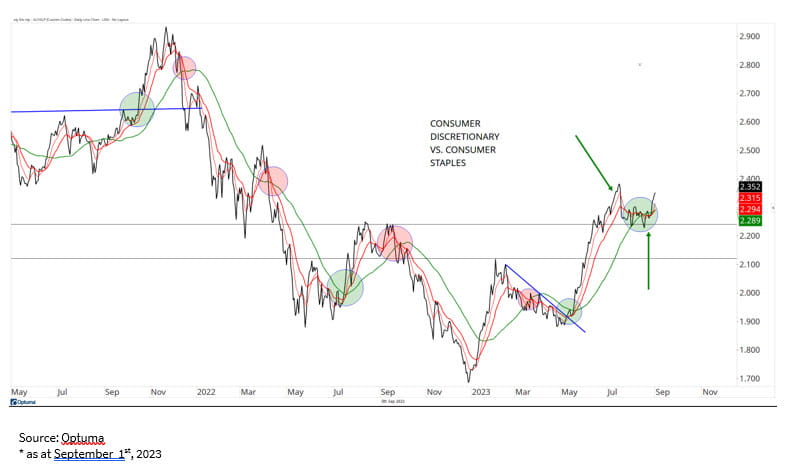
For the second chart, let’s look at the consumer discretionary vs. consumer staples relative line and you can see the recent breakout that happened in favour of the more offensive side of consumer stocks which demonstrates that the market is more aggressively willing to spend money on the stocks of companies tied to economic strength and consumer spending than those defensives. It’s bullish behaviour overall.
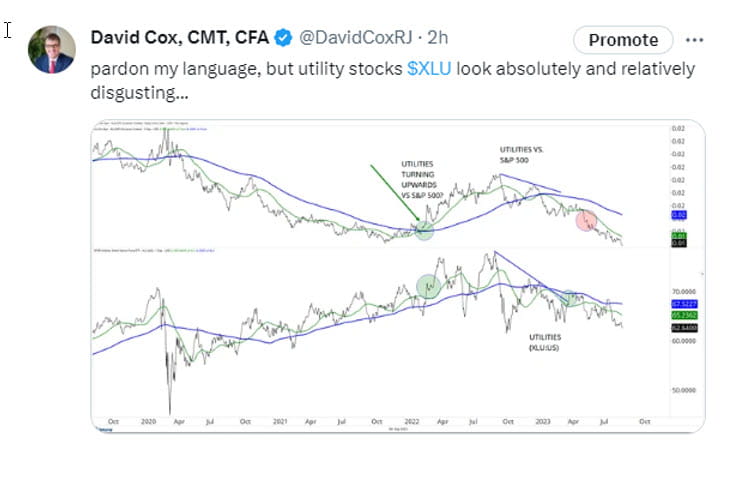
Social Media Corner
I still find it weird that Twitter is now “X”. No more “tweeting”, but whatever it’s called, I’m regularly found posting charts, tables and perspective on the markets seen through the lens of investors. Point yourself over to @DavidCoxRJ and give it a try!

Upcoming Dates, Seminars, and Announcements
I recently wrote an article for Benzinga.com called “Industry Deep Dive – Let’s Look at Oil Services” and if you’d like to see it, you can click:
https://www.benzinga.com/author/david-cox
Happy September!
Your feedback, questions and/or comments are always welcome…
Sincerely,
David Cox, CFA, CMT, FMA, FCSI, BMath
Senior Portfolio Manager, Wealth Advisor
Raymond James Ltd.
Phone: 519.883.6031
Unit 1 – 595 Parkside Drive | Waterloo, ON | N2L 0C7
david.cox@raymondjames.ca
www.financiallyinsync.com
![]() @DavidCoxRJ
@DavidCoxRJ