Quarterly Strategic Review - 3rd Quarter (Jul-Sep, 2023)
RISK MATTERS IN A CORRECTION
Pullbacks can be challenging, especially mentally, as giving back hard-earned gains in our accounts isn’t fun. Thoughts of past bear markets and calamitous global events make us think that the best of the opportunities are behind us and we should have sold.
Time frame is tricky for all of us investors. We here at the investment helm of “Financially INsync” continue to strive towards doing a better job of holding our stocks for long enough and getting better at maximizing the opportunities that present themselves instead of being too short-term oriented. We have significantly reduced our transaction activity in your accounts since we moved over to Raymond James last year, and that is/was by design. To earn a +10-12 per cent return on a stock can sound great on the one hand. But, on the other, if that same security or investment ends up potentially offering +50-60 per cent by being more patient (which would have required us to sit more patiently through the short-term gyrations), I do think that should be our goal.
Then again, it depends on risk preferences. As is typical, the most aggressive among us (that includes me) will typically maintain a shorter time horizon, given the (on average) riskier and more volatile stocks that we invest in. This is akin to comparing the types of securities that we would buy under our large-cap, trend following #INsync universe type approach vs. the spicier, breakout stocks that are offered via a strategy like “INvertigo”. The exchange-traded funds (ETFs), now referred to as “ETF INfocus” sit in between. So, as we sit here in October and I write, I will point out that, as I’d expect, it was the “Aggressive” and “Long-Term Growth/Aggressive” investors that experienced the most drawdown since the July 2023 highs, all the way down to the “Capital Preservation” clients that had the least drawdown. But let’s not forget that less drawdown can be good on the one hand, in hindsight, but the opportunity and YTD gains is much less too. As we all know, seeking higher returns does require higher risk.
INTEREST RATES ARE ATTRACTING OUR ATTENTION
We all know that interest rates have been rising, and they’ve been doing so incessantly in the past couple of years, particularly going back to COVID times. To imagine and remember that investors in many parts of the world were even willing to take a guaranteed loss (a negative rate of interest!) seems almost absurd in hindsight (note: I thought it was absurd at the time too, and so, no, we certainly did not participate). We’ve been very uninterested in fixed income opportunities for years, but have recently been wading in a little more this past quarter. Why? What if interest rates continue to climb, you ask? That’s fine if they do. We’re picking fixed maturity, short-term (i.e., 12-18 months) instruments and using GICs and/or other highly rated (A or better) positions to increase these exposures. The yields we’ve been getting lately are 5.5+ per cent and to diversify and create balance, we’ve been adding some.
It’s almost like the old-school principles of diversification are back. You see, as interest rose and bond prices suffered last year (right along with stocks), there was no advantage to diversification. I have pointed out a few times before that diversification into uncorrelated assets is great, but diversifying into uncorrelated assets that are rising is even better!
And so, by buying some GICs and other short-term bonds in registered/tax-sheltered accounts, we can smooth out the fluctuations in your account and increase stability, which seems like a win. But it doesn’t change my view and expectation that this big-picture interest rate cycle is new and has changed and the past 40 years will be quite unlike the road we’re now on. For years, it’s the savers (you) that have been punished and unable to generate much income from their savings and investment capital, and now, it’s the borrowers who are being punished. Those that borrowed too much from the future are going to have to accept that mortgage rates are going to renew at much higher levels and living above means, via a line of credit and or credit card debt, is VERY expensive. It’s going to take time to expect Canadians to adjust. Many, including the media reporting on it, seem to still be sticking with the rates-will-soon-be-coming-back-down expectation. I don’t see that, and while they may indeed fall in the short term, I think the long-term, generational move ended. It’s time for a new generation.
We are in a world with debt bubbles all around us. I’d encourage you to check in on your kids and grandkids and perhaps use this as an opportunity to discuss the impact (if you need help with this, we’d be able and willing!), to help facilitate some discussion amongst the younger generation in your families about borrowing, saving and rational finance. PLEASE ASK US!
“BALANCED” RISK BUCKET
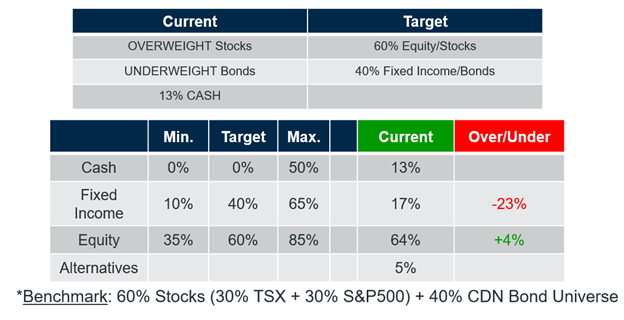
Source: Croesus
As at October 17, 2023
“CAPITAL PRESERVATION” RISK BUCKET
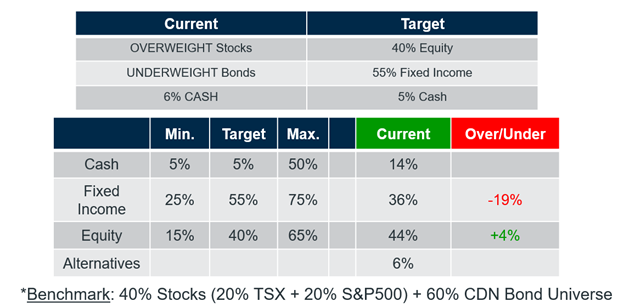
Source: Croesus
As at October 17, 2023
“BALANCED/LONG-TERM GROWTH” RISK BUCKET
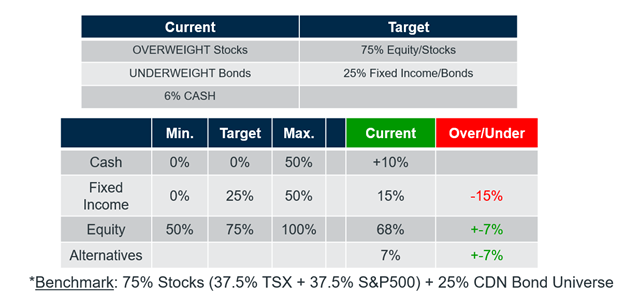
Source: Croesus
As at October 17, 2023
The three buckets above, all contain some degree of fixed income and each of those buckets has increased that exposure during the quarter (and increased cash as some stocks stalled, peaked and turned lower, as happens during a stock market correction). As a reminder, as the “Aggressive” and “Long-Term Growth” risk buckets are equities only, I’m not going to bother to waste space on the tables. We have been largely long of equities although cash positions have risen in the past quarter, despite putting some back to work in the past couple of weeks, as the market showed signs of bottoming.
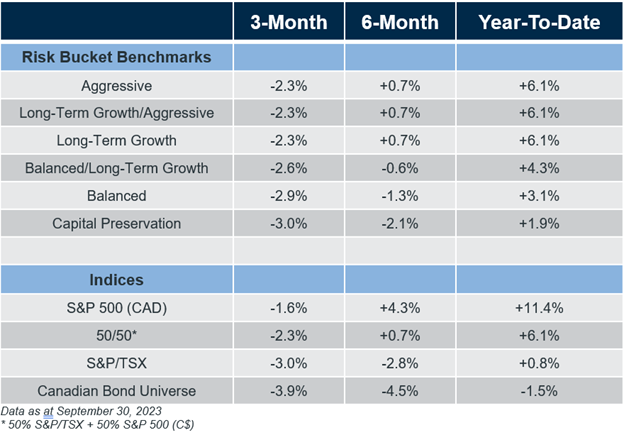
OUR PERFORMANCE
In the following table, we can see the index returns for stocks and bonds and the benchmarks for our various client risk buckets. From a practical perspective, we can say clients that take more risk, i.e., those in our “Aggressive” and “Long-Term Growth/Aggressive” risk buckets should expect to lose more in a tough quarter. That happened! And full disclosure (well, not quite!), equity-only mandates lost more on the whole vs. the 50/50 benchmarks shown… [NOTE: We typically share more details, which have unfortunately been redacted this quarter. We will strive to figure out how to navigate the new requirements that have been put on us this month, in an effort to provide more transparent and comprehensive information as usual in future].
As a reminder, for equities, we use a 50/50 blended benchmark which includes 50 per cent of the return of the S&P/TSX Composite (Canadian stocks) and 50 per cent of the return of the S&P 500 (U.S. stocks), both in Canadian dollars. Of particular note is the bond market which did worse than stocks in the past three months and (again) has negative year-to-date returns for 2023 (following up on 2022). This is why the Capital Preservation benchmark actually had the weakest quarter, because of the weakness in the bond market.
The aggressive accounts had considerable giveback during the correction, largely as growth oriented, INvertigo type stocks pulled back and gave up sell signals, some after considerable weakness. As I wrote earlier, it can be tough, to have a market we remain positive on and trying for the larger gains that can come from stocks to decide whether to take profits and/or sell them. In the past quarter, in hindsight, more selling would have been advantageous!
SECTORALLY SPEAKING
Not much has changed in the past quarter, sectorally speaking. We always want to be aware of where the relative strength is and it’s the technology, communications and energy stocks (with discretionary and industrials losing some lustre) that sit in the top relative spots at this juncture. Technology stocks had peaked before the broader S&P 500 index, which led to the Nasdaq peaking first in July, but that’s also the area where new buying has been most evident.
Even within technology, there are considerable differences among industry group strength and it’s fair to say that, as you might have seen me write and/or speak about, the cyber security stocks are a standout at this point. So, that means we like at least some of our technology exposure to come from there, and it’s also no coincidence that several of the individual stocks that we own, come from the cyber security group too.
OUR STRATEGIES
ETF INfocus (formerly named “ETF 6/16”)
I thought it might be interesting to show you a correlation table, in this case 26 weeks, which helps us see and understand the degree of “sameness” in groups of stocks. You see, if everything moves together all in the exact same fashion, we don’t get to diversify, and perhaps more importantly, if we don’t get to diversify and/or seek relative strength from a particular group, we would generally favour owning the broader market, or sector itself because there is less risk.
In this case, I’m referring to risk as the amount of percentage change up/down that a given investment offers. The stock market has a level of risk, an individual sector generally has more than the market, and the industry group level and/or thematic ETFs have more than that (and individual stocks have the most!).
What can I point out in the table below amongst the ticker symbols that are widely owned in your accounts? Look at the fourth column “TECH” – this is the Evolve FANGMA ETF (which owns Facebook, Apple, Netflix, Google, Microsoft and Amazon) – it has very high 0.81 correlation with ZQQ (Nasdaq), which makes sense, because those six stocks make up a considerable weighting in that market. Look at “PHYS” and “CEF” – that is gold and/or silver, and those low numbers, in many cases even negative. This means those assets are not moving around these days in correlated (similar) fashion and beating to their own drum so to speak. So, if they’re going up (they’re trying to get going again right now), then we can gain value by diversifying into them.
I’d also like to point out that “BTCC” has a very small correlation with all those other assets, which means Bitcoin is not the same either, so we get diversification and overall risk reduction by owning some. “BITQ”, a very volatile ETF with a focus on that crypto-currency space, is highly correlated to Bitcoin, which makes sense too. I hope you find this somewhat interesting and/or helpful!
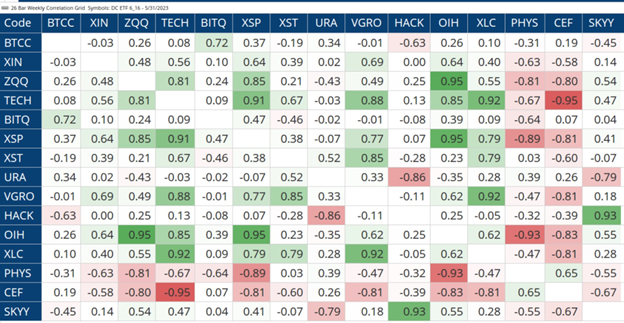
Source: Optuma
As at October 15, 2023
Based on our overall holdings, at an all-client level, here is a pie chart that represents our exposure. You can see that North American listed ETFs are the biggest chunk (think S&P 500 and Nasdaq) and gold, cyber-security and FANGMA, all recently mentioned, are also important exposures.
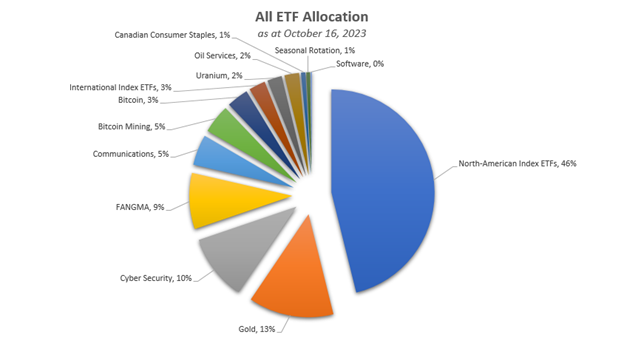
Source: Croesus
As at October 16, 2023
We came into 2023 with exposure to the U.S. homebuilding stocks (ITB:us), which were an early leader off the fall ’22 bottom but we determined them to be peaking this summer and so, we sold our position accordingly. Here’s the chart, showing the breakout purchase that we made (blue circle) in November 2022 (while still at the bank) and then the red circles representing our sell points as we trimmed and then sold the position outright.
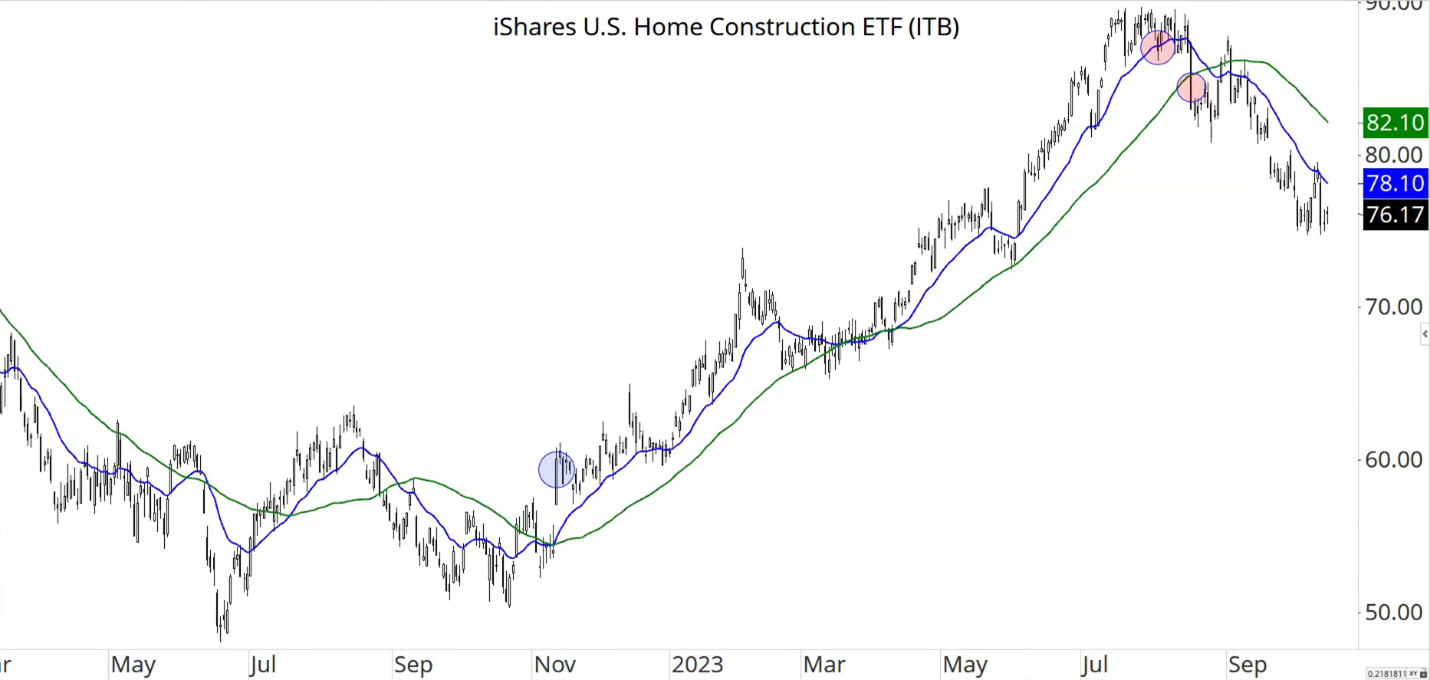
Source: Optuma
As at October 16, 2023
FINANCIALLY INsync UNIVERSE STOCKS
Our universe, which is rebalanced once each quarter, now has 102 stocks in it for the quarter ended September 30. As a reminder, these stocks have been screened, as at quarter end, and have demonstrated returns greater than the S&P 500 for each of the 1, 2, 3, 4, 5, and 10-year time frames.
As a way to demonstrate the long-term, trend following approach, let’s look this month at Eli Lily (LLY:us), a mammoth $580 billion-dollar mega-cap stock that provides branded pharmaceuticals to treat neurological, endocrinological, oncological and cardiovascular diseases. The long-term weekly chart (top panel) shows that it’s been in a strong uptrend for the past five years and the short-term (daily) chart below, shows that even stocks like this are still permitted to move around, and in early 2023, LLY traded below that 200-day moving average (shown in blue), but so what? Although in the past, we would have sold the stock for violating such an average, you can see how foolish (in hindsight, of course) that would have been. That short period of time below the 200-day mark, became the launch pad for what has become an almost +100 per cent move from the ’23 lows. So, what have we done with the stock? Nothing. In fact, during the last dip, some of you had positions that were too small, and we added to them.
That, of course, follows the process and belief that doing more of what is working and less of what is not is smart, and adding to winning stocks and selling/trimming losers is wise.
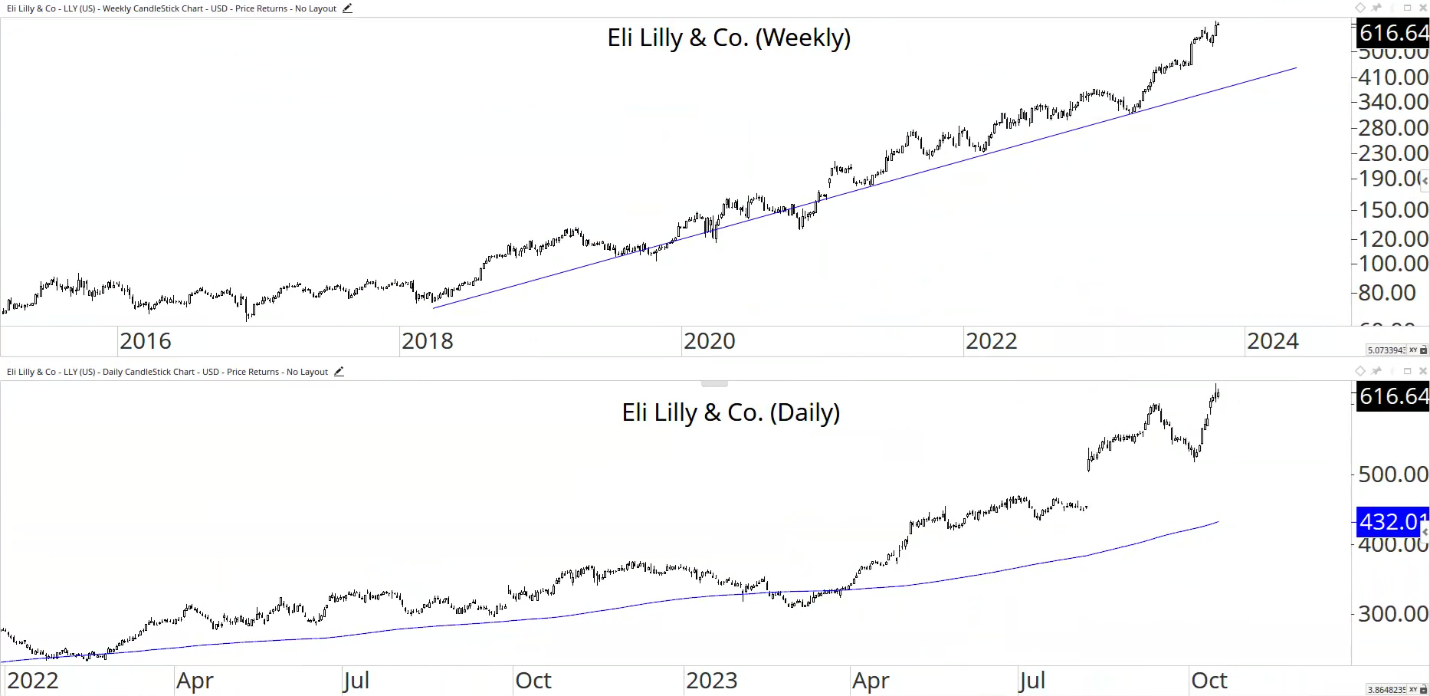
Source: Optuma
As at October 16th, 2023
Our largest and most widely held positions from the INsync universe with our initial cost bases since introduction into portfolios include the following:
Dollarama (consumer staples – retail): +17.6%
Old Dominion Freight Line (industrial – trucking): +21.9%
Cintas Corporation (industrial – uniforms): +15.8%
Synopsys (technology – semiconductors): +22.9%
Eli Lilly (health – drugs): +89.5%
INvertigo
The INvertigo type stocks had been on fire into the July highs in the stock market, but since then, so many gave up (and painfully stole paper gains from those that held on). Sure, we trimmed a few things here and there, but a couple of the electric car stocks and crypto-related positions came back against us to bite.
Right now, aggressive clients are sitting roughly 12-14 per cent INvertigo type stocks, having not only pared back, but also not having been a buyer of such breakout stocks as we added equity back in to accounts since the recent lows. Why? Because those types of stocks aren’t performing very well and are not what the market is rewarding. So, if good quality stocks, even #INsync stocks, offer entry points, uptrends and strong relative performance, we’ll take those, until the market shifts gears once again. Remember, we’re in the seasonally strong time of the year in the months ahead, and if we start seeing breakout stocks do what they’re supposed to (break out and climb higher!), we’ll of course be more than willing to jump on board.
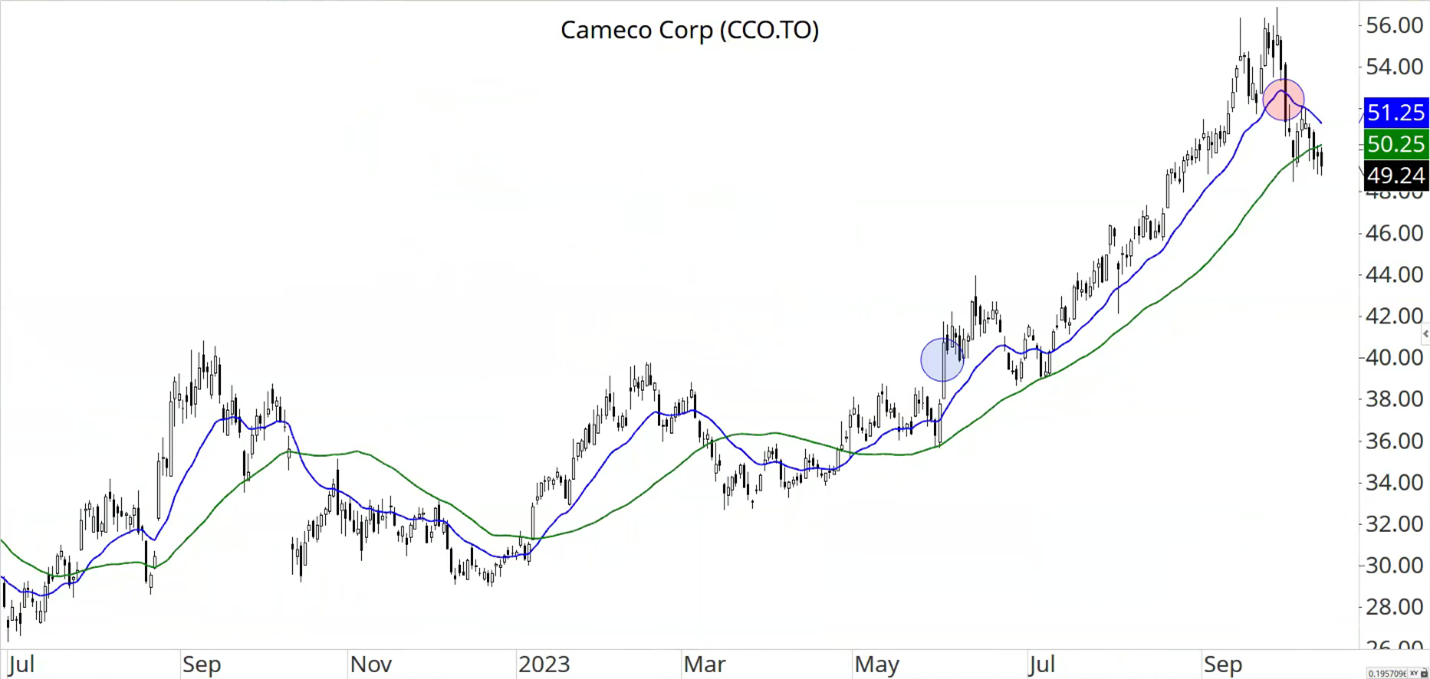
An area that you’ve seen us refer to in recent webinars would be uranium. Here’s Cameco (CCO:tse) and our buy point shown in the blue circle. We had enough of a volatility move off the top, that we trimmed 1/3 of our positions (red circle) but continue to sit on the remainder stock. I will also point out that Cameco now meets the INsync Universe screen after the recent update. So, it’s a rather robust stock, but that doesn’t mean it can’t bounce around (and it is volatile, to be clear). We also own the Uranium ETF, which is good, because it means the broader group is healthier than just our one stock. But did it just peak? We don’t know, but thankfully, we have a process that will happily sell if and when necessary, because a scenario that would see us lose all those gains back to the buy point is not what we’re looking to do!
NOTES FROM THE “FINANCIALLY INsync” TEAM
The third quarter performance reporting was released on RJ online and shows the performance of your own accounts and the shorter quarterly write-up. This supplementary review is in addition to that. If you have any questions about this reporting, your risk bucket classification or anything else at all(!!), please don’t hesitate to reach out to a member of our team!
IT’S TIME…
Just because the markets seasonally do well on average at this time of year, doesn’t mean they will. Yes, I’m aware of the big new wars and Middle East events and the potential risk they bring. There are always risks and there always will be. But we’ll continue to steer your portfolios using our process and appropriately position them for an environment of continual change, accepting the simple fact that “anything can happen”. Which means that even great companies can go bankrupt! (And no, that isn’t a play on some media rumblings about the troubles now at Pfizer, as sales have plummeted and massive layoffs are occurring.)
I hope this content is both useful and insightful, and if you have feedback (either positive or negative!), please don’t hesitate to share it. Thank you!
David Cox, CFA, CMT, FMA, FCSI, BMath
Senior Portfolio Manager, Wealth Advisor
Raymond James Ltd.
Phone: 519.883.6031
Unit 1 – 595 Parkside Drive | Waterloo, ON | N2L 0C7
david.cox@raymondjames.ca
www.financiallyinsync.com
![]() @DavidCoxRJ
@DavidCoxRJ