Monthly INsync Chit Chat June 2024
Streaks and Road Trips! [by David Cox]
Those of you that know me well, know that I’m a data junkie and math geek which of course means I keep data on lots of things and like to pursue new habits by the challenge of keeping streaks alive! A couple of long-running streaks include: 316 days of using Duolingo to learn Spanish, which I started before travelling to Colombia, and then Costa Rica last year. I’ve also done 50 push-ups every day since late October (234 days!) and I think these two are good for both mind and body, so I’d like to keep them going! That said, I admit, there are times when I lay down for bed, realizing I haven’t done my push-ups and am forced (argh) to get up and do the set! (I’ve done the same for my walk outdoors streak, that one is harder – to have to get dressed again to go for a walk).
I’m writing from North Carolina and am on a road trip with my two middle boys, Asha (16) and Emry (13). We’re in Black Mountain for the annual Wilson Hill Academy LINK trip, which is the online, classical Christian school that they attend. LINK is the annual meet-up where family and fellow students gather geographically for some fun! Asha drove half the way here, and we split the drive further with a Memorial Day break to see the Cincinnati Reds play the St. Louis Cardinals for some baseball. It’s beautiful here in the mountains and lovely weather surrounds us!
News – Some That You’ve Heard, Most That You Haven’t [by David Cox]
Boeing set to provide action plan to address FAA Safety Concerns. Bank of Montreal’s shares sink as bank signals that credit pain will persist. Ontario education minister criticizes school boards for lawsuits against social media companies. Ukraine introduces jail sentences for filming any person conducting forced conscription and apprehension. Astra Zeneca pulls its COVID vaccine from the shelves, as injury compensation starts to flow in the U.K. for clotting and other damages (government paying for damages, not the drug company). CSIS (Canadian CIA) proposes jail time in Canada for those that speak out against child sex changes, labelling it “religiously motivated violent extremism” or “individually motivated violent extremism”. Germany removes a section of their criminal code related to the possession of child pornography (now reduced to a misdemeanor). American Airlines says any injuries or illnesses sustained in employee camera filming in airplane lavatory were caused by plaintiff’s own fault and negligence (a 9-year girl was at the centre of this).
Things We Recommend [by David Cox]
I was in attendance this past month at the Canadian Bitcoin Conference in Montreal and one point stood out as a recommendation to the millennial generation, particularly those feeling that they’re forever priced out of the possibility of owning a house in Canada. Instead of watching the price of your dream type home rise well beyond your grasp in dollar terms, use Bitcoin.
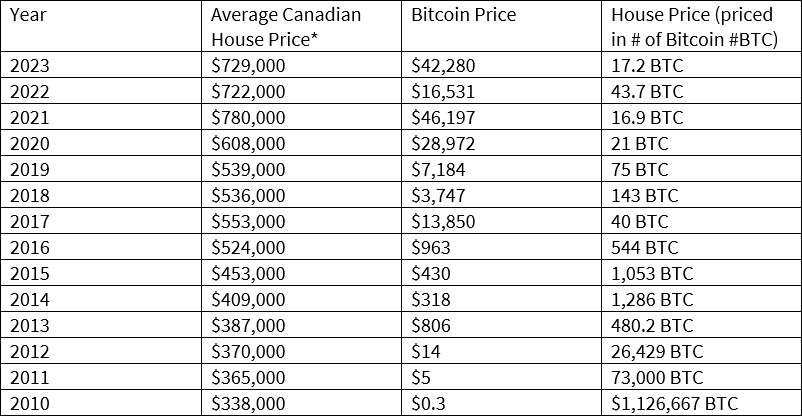
Source: TradingEconomics.com, Optuma
* * as at May 26th, 2024
In 2010, it would have cost more than 1.1 million Bitcoins to buy the average Canadian house. Five years later, in 2015, it “only” cost 1,053 Bitcoins. In 2020, it cost 21 Bitcoins to buy a house. And at the end of 2023? 17 Bitcoins would buy the average Canadian house. In hindsight, house prices have become cheaper, actually much cheaper, when priced in Bitcoins. The government continues to inflate away our purchasing power without any limitation on the amount of money supply, which as more money buys the same goods, prices have risen. Bitcoin has a finite supply and, is usable all around the world (have you ever tried to pass off Canadian dollars anywhere other than the U.S.?). At the very least, ponder this.
Book Corner [by David Cox]
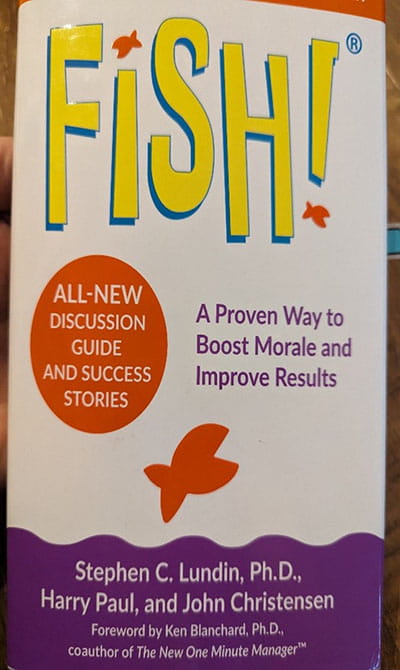
Last fall, our “Financially INsync” team attended a team building conference put on by Mindset Consulting. Have you ever been to the Pike Place Fish Market in Seattle? If you have, you likely remember the joyous chorus, singing and entertainment provided by a certain group of fish mongers as they launch fish through the air offering entertainment to customers and by standers all the same. Why are they so happy? Do you lead a team? Are you on a team? Lead a family? Sit on a board or charity organization?
There are some great ideas, and tips about engaging others and creating an environment to foster and bring out the best of everyone. Attitude indeed matters and this is an easy read that I thought you might enjoy too!
What Are We Buying? Selling? Holding… [by David Cox]
Copper stocks embarked on a huge rally that started in March 2024 after a period of consolidation. Our clients will of course be familiar with this, and we sought to participate in a number of ways, one of which was Southern Copper Corp ($SCCO). It broke out early, ahead of the group, offering a first buy point (left-most green circle) and some of our clients got on board. Shortly thereafter, the whole group demonstrated significant and impulsive buying pressure as demand suddenly overwhelmed supply and the underlying price of copper experienced the same environment. $SCCO clearly broke out of a 1-year base on March 13th (2nd green circle), and we participated in size, meaning more broadly (and added in some cases to existing positions). The rally continued with little pullback other than a couple of days down as the uptrend continued… then the “biggest bar against” and an ugly gap down (red circle). What causes that? More sellers than buyers, and at the same time, as discussed, that week on the “Where Do We (Investors) Stand?” Friday webinar, copper had a significant pullback. Suddenly, after the strong demand, sellers strengthened and knowing that price moves around based on demand and supply, we acted and took profits for our more aggressive clients happy to book some profits after a strong rally. Does it mean the stock has suddenly peaked for good? Nope. Does it mean it might have to go through a period of consolidation? Yes. Is anything certain? No. Stock markets aren’t about certainty. As investors and stewards of the capital our clients entrust us with, we strive to execute on our process in order to seek to maximize risk-adjusted returns.
Selling is more important than buying as it’s selling that determines whether you make money or lose money on an investment. We all need to keep that in mind. And time frame matters: a short-term peak does not mean (necessarily) a long-term peak. We act differently for our clients depending on their own risk tolerance. The last thing any investor needs is to be buying and selling excessively based on what can only be accepted as normal daily volatility, and a character that each stock possesses.
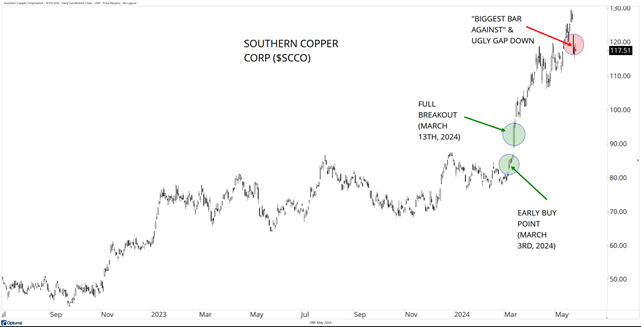
Source: Optuma
* * as at May 26th, 2024
Lifestyles to Consider! [by Criselle Tung]
I have travel plans to go to Asia in November and February. The flights are no joke! Prices can range from as low as $1,300 for a 40-hour flight to as high as $5,000 for a 20-hour flight. Of course, I booked neither of these options. I did my research, asked around, and let me share what I’ve learned.
Among the common tips like booking in advance, using miles and points, price watching, and checking promotions, the most intriguing one is Google Flights Explore. This feature allows you to input your departure city and leave the destination blank, revealing a map with prices to various destinations, helping you spot good deals in one go. This method is particularly effective for spontaneous travelers who are flexible and open to visiting different destinations based on where the best deals are.
Moreover, even if you have a specific destination in mind, this method can still be beneficial by avoiding algorithmic bias. Avoiding repeated searches for the same destination may prevent algorithms from tracking your activity and subsequently increasing prices based on perceived demand. It’s also an idea to use incognito browsing when searching for flights.
While I can't claim to be a tech expert, I've found this approach effective. My past experiences reinforce this: I've visited Thailand over 10 times now. When I mentioned to a friend my plans to visit again, my social media feed was suddenly flooded with ads for Thailand, featuring inflated prices and highlighting places that I've known as overrated tourist traps. Maybe you can try it out and let us know how it works for you!
How’s the (Bigger Picture) Market? [by David Cox]
April was a down month and at this point, May has offered a strong bounce back in stocks. Some will complain about seasonality and recite the “sell in May and go away” phrase, others will complain about valuation and suggest it makes little sense that the equity markets can continue, but we’ll continue to take the market’s opinion over our own. The April selloff pushed us RSI(5) oversold on the weekly chart (a reminder that weekly oversold points don’t occur very often) and now, we’re sitting overbought after the bounce back. Higher highs and higher lows is the definition of an uptrend, so we don’t want to get caught digging in the weeds and missing sight of the bigger picture. Stocks are in an uptrend and have been for some time.
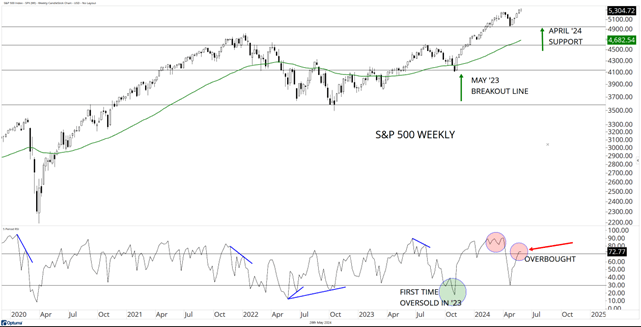
Source: Optuma
* * as at May 26th, 2024
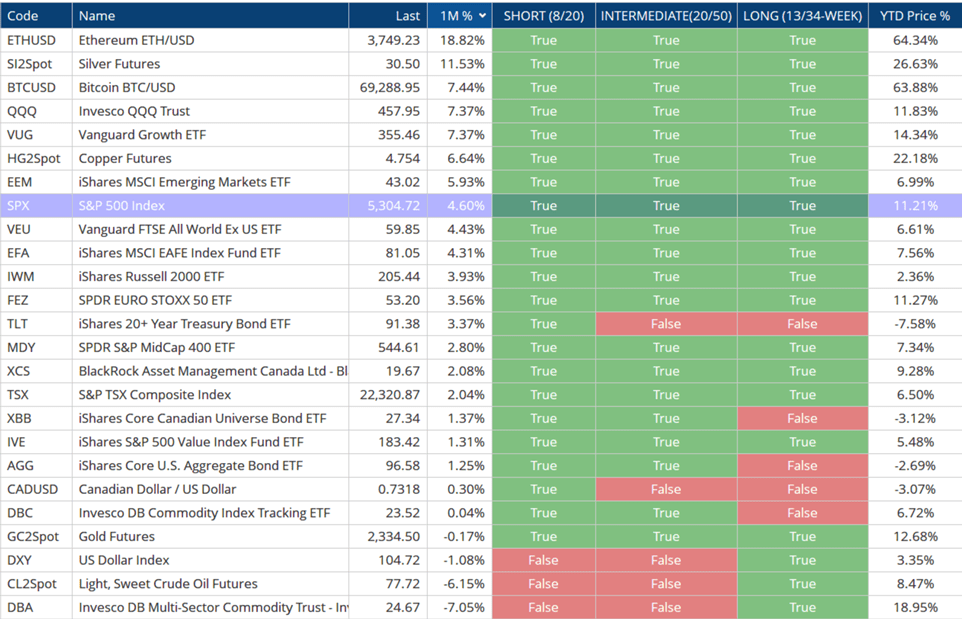
Market Summary and Trend of “All Assets” [by David Cox]
As I just highlighted, in a bounce-back month for risk assets, we’ve seen a significant shift as the amount of green on the table below is obvious if you compare. Sorting by 1-month price returns, we can see that the Nasdaq 100 ($QQQ) bounced back more strongly than the S&P 500 (which itself was +4.6% on a 1-month basis when I printed this). Silver and Bitcoin were stronger, as they’ve been this year and too, are in uptrends. The bottom of the list still sees crude oil, an important part of the commodity complex struggling around that $80 level for a barrel.
Source: Optuma
* * as at May 26th, 2024
We All Need to Keep Learning! – “Understanding the Role of Volume” [by Conor White]
At Financially INsync, we often say that price is the most important factor in our investment process, but price only tells part of the story. Volume, the number of shares or contracts traded during a given period, plays a crucial role in understanding market movements. It can be used to confirm trends, identify potential reversals, and offer insights into market sentiment.
Why Volume Matters
Volume acts as a validation tool for price movements. When prices move, its important to understand whether the movement is backed by substantial trading activity. Here are a few examples of how volume can be analyzed when making decisions:
- Strength of Trends
- When a price movement is accompanied by high volume, it indicates that a large number of participants are involved, which adds credibility to the trend. For instance, if a stock price is rising and the volume is also increasing, it suggests that there is overwhelming demand, and that the uptrend is likely to continue.
- Conversely, if a price movement occurs on low volume, it may indicate a lack of participation and possibly a weaker trend. A price increase with low volume might suggest that there are only a few buyers that are pushing the price up, which raises doubts about the sustainability of that trend.
Take a look at Super Micro Computer ($SMCI), which traded sideways for over six months. On January 19th, it was clear that market sentiment towards the stock was beginning to shift as the stock broke out to new highs on an overwhelming amount of volume. What happened next was a rally of more than 250% in less than two months!
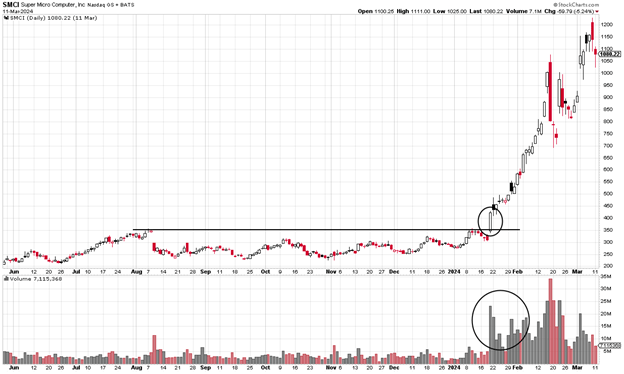
Source: Stockcharts.com
- Identification of Potential Reversals
- Volume spikes: A sudden, unusually high level of volume can indicate a possible trend reversal. For example, during a downtrend, a significant volume spike might suggest that sellers are exhausted, and buyers are stepping in. Similarly, in an uptrend, a volume spike on a down day can signal that selling pressure is increasing, which raises the probability that a reversal is imminent.
- Divergences: Divergences between volume and price are powerful indicators of potential reversals. For instance, if a stock’s price is making new highs but volume is decreasing, it indicates that fewer participants are willing to buy at higher prices, which suggests that momentum is weakening.
- Gauging Market Strength
- Breakouts and Breakdowns: For breakouts (when price moves above resistance) and breakdowns (when price falls below support), volume is a confirming factor. A breakout on high volume indicates strong conviction and is more likely to sustain an uptrend, whereas a breakout on low volume may be more prone to failure.
- Volume often leads price. For instance, an increase in volume without a significant price change can indicate that a large move is brewing under the surface.
This breakout in Marathon Digital ($MARA) last year occurred on high volume and led to a nearly 100% advance in less than a month.
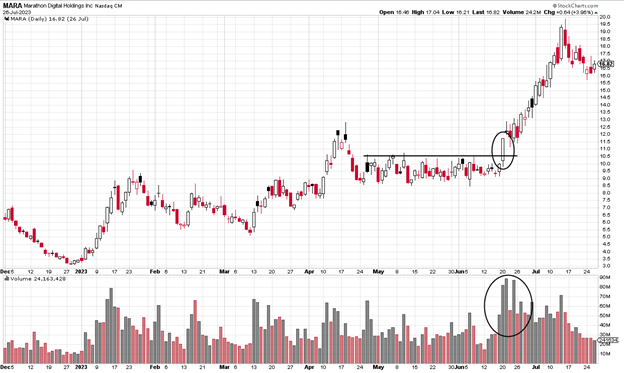
Source: Stockcharts.com
Incorporating volume analysis into your trading strategy can significantly enhance your understanding of market dynamics and improve your results. If you’d like to do a deeper dive, I would recommend back-testing volume-based strategies on historical data to see how they perform under a variety of market conditions.
This Month in Innovation [by Conor White]
OpenAI announces GPT-4o, a new flagship model that can reason across audio, vision, and text in real time.
Airbnb introduces Icons – extraordinary experiences from the world’s greatest icons.
South Korea plans 120 GW space solar project.
mRNA Cancer Vaccine Reprograms Immune System to Tackle Glioblastoma.
AlphaFold 3 predicts the structure and interactions of all of life’s molecules.
Gene editing improves vision in some people with inherited blindness.
Neuralink’s First Patient: ‘It Blows My Mind So Much’.
One UPtrend, One DOWNtrend [by David Cox]
This month we’ll look at two stocks from the solar industry group (part of energy), although a little shorter-term than what I’ve been showing in this column in recent months. Remember, uptrends and downtrends can take place on varying time frames, which really do matter for context. A stock can be falling in the short-term in a long-term uptrend and vice versa.
The solar group has been VERY weak in recent years and a very stiff pullback has occurred. But, in early April, First Solar ($FSLR), which is the largest company in the group, surged with new buying interest in early April and came to life. I always like to watch strong sectors and weak sectors alike because I know that they can change, sometimes with little notice. The stocks that move first and drive early leadership are often important and tell us that the big investors (for whatever reason) are expressing their convictions by putting their money to work. In the chart below (left side), you can see the strong and very impressive trend of $FSLR, which has just surged to new all-time highs in a very short amount of time.
Contrast that to Solaredge ($SEDG) and you have the opposite story. It’s in a clear lower highs and lower lows downtrend and not speaking the same language as First Solar. Some will want to try to share something about their company or the headlines about the company. I instead will prefer to spend my time more efficiently acknowledging that First Solar moved first and then watch carefully for follow through in the rest of the industry group, which we’re starting to see. Does it mean that Solaredge will be an excellent stock in the next six months? Nope. It could continue weakly, but in the event that the solar stocks do ripen in the approaching heat and sunshine of summer, I’d expect the others to start to draw some of their own interest as investors who perhaps missed the early leader decide it’s safer to try to play the next potential mover.
I always like to remind all of us that the easiest way to get (and keep!) your investment portfolio rising is to own stocks and securities that are rising in price. Leave the downtrends for others that “hope” it will change as they cook up reasons for why the market is wrong. Better for our investment capital and better for our mental capital to stick with uptrends.
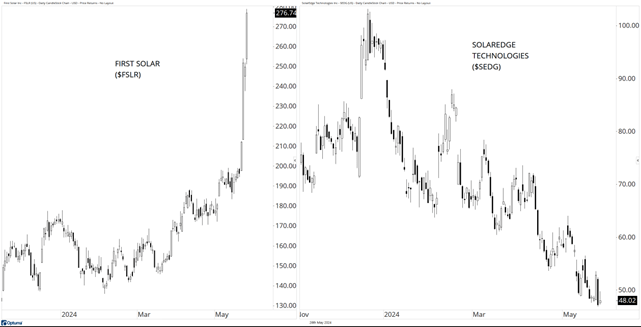
Source: Optuma
* * as at May 26th, 2024
We Like Fundamentals Too! [by David Cox]
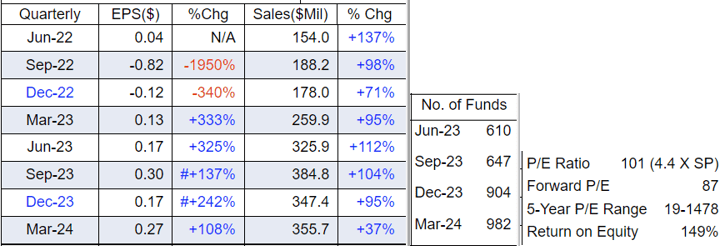
Celsius Holdings ($CELH) is a $22.2 billion company that develops and markets functional calorie-burning (energy) fitness beverages and recently started selling its cans in Canada. It has been a very strong stock, albeit one that has more volatility than most large cap stocks, of similar market cap-size, let alone its peers in the more typically “defensive” and slower-moving beverages group in the consumer staples sector.
You can see their very strong +30%+ sales growth (y/y) in the table below and they’re starting to make some serious profits. A year ago, they lost 5 cents/share and in December 2023, they earned 88 cents. The last two rows in the table show the analyst forecasts. And the stock is another one of the “4 quarters rising” stocks that you’ve heard me refer to… that means there have been an increasing number of reporting institutions buying the stock and taking an interest in what they see.
Source: MarketSurge
* * as at May 26th, 2024

Source: Optuma
* * as at May 26th, 2024
It’s a very tricky stock and broke out of another base in early 2023 on earnings, but we weren’t patient enough (in hindsight) and let it go, only to try again on the recent breakout (second green circle). And then of course, it comes back in with the market (so classic). It’s volatile and admittedly in the technology sector, which has been losing oomph. So, a couple of challenging factors against it, but it checks lots of the boxes we like to see and is, fundamentally, a strong story that might become more known over time.
Chart of the Month [by David Cox]
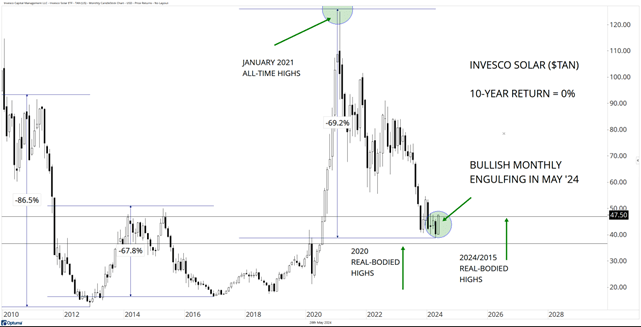
Furthering on with some of the earlier discussion about solar stocks, I’m going to show the Invesco Solar ($TAN) ETF here as the “Chart of the Month” for June. We already talked about early leadership by First Solar, and continued downtrend by Solaredge, and both of those stocks are contained within the $TAN. This is a volatile industry group! From the January 2021 highs, the ETF was -69.2% to the recent lows.
There is a lot of information on the chart below and several lines, but I note that this new buying here in May 2024 is set to offer a “bullish engulfing” pattern and it’s happening at an interesting spot where prior strength, in 2020, and a prior peak, in 2014, took place. On a 10-year time frame, the total return for an investor holding solar stocks via this ETF is 0%. That’s right, huge rallies, huge crashes all for what? Nothing to show for it. Many governments around the world continue to suggest a green energy future, but the market hasn’t been buying it. Narrative aside, I think the stocks in $TAN and $TAN itself should be watched carefully here for opportunity. Please do your own research and do NOT forget this is a VERY volatile group!
Source: Optuma
* * as at May 26th, 2024
Social Media and Our Website [by David Cox]
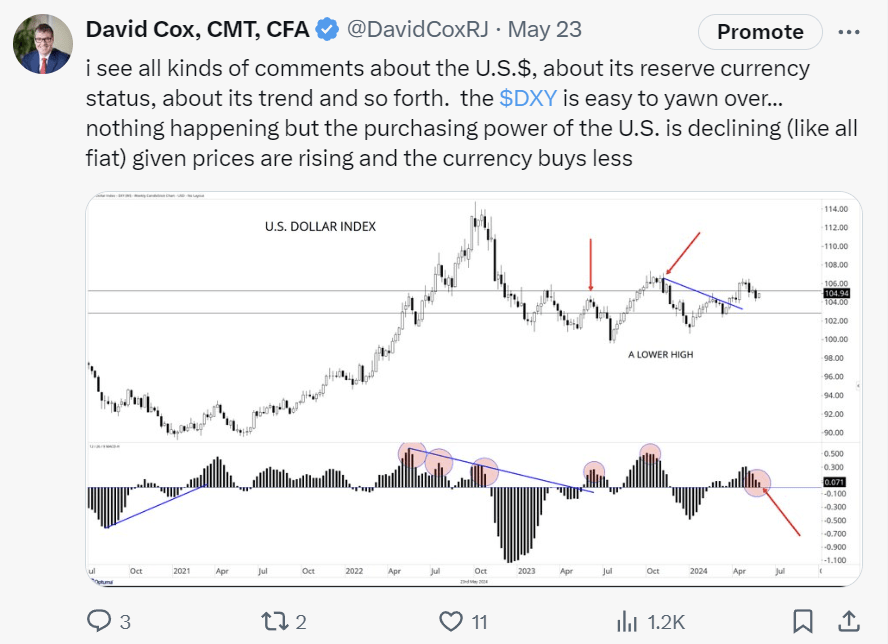
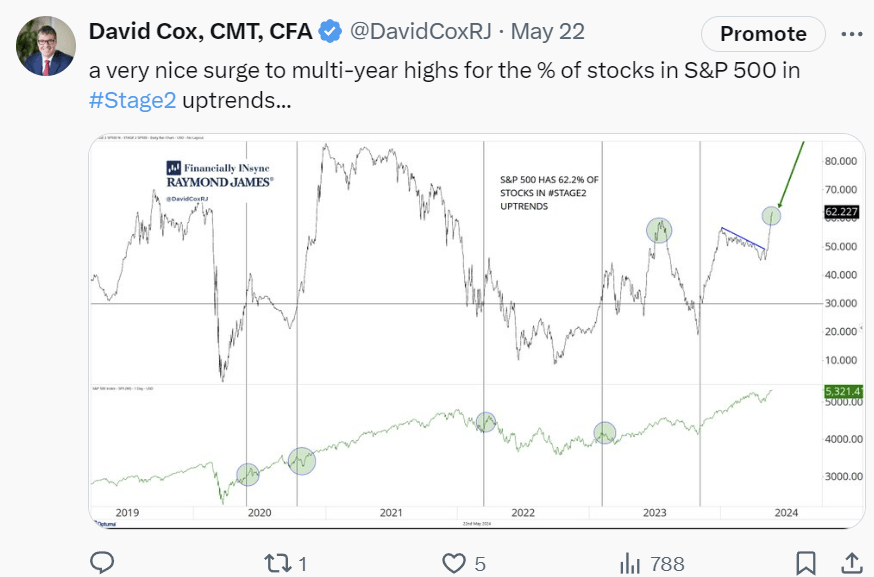
I’m regularly found posting on “X” (formerly Twitter) and sharing a variety of insights, charts, perspectives and trying to offer things to think about. I love the engagement, the questions and comments, and it’s a great environment to share ideas and talk markets. Wander over there someday if you haven’t yet. Here’s a couple of posts from the past month that I posted.
Upcoming Dates, Seminars, and Announcements [by David Cox]
What: Bitcoin 2024 Conference
Where: Nashville, TN
When: July 25-27th, 2024
Who: I’m very excited to check out this growing event!
What: Rossland/Trail, British Columbia
When: September 9-16th, 2024
Who: Visiting with B.C. clients!
What: Nomad Capitalist Live!
Where: Kuala Lumpur, Malaysia
When: September 25-28th, 2024
Who: Another long flight, but the conference looks VERY awesome!
Thanks for reading our “Monthly “INsync” Chit Chat”! Please don’t hesitate to offer comments, criticisms, or ideas to make this a more valuable publication. Thanks in advance!
Sincerely,
David Cox, CFA, CMT, FMA, FCSI, BMath
Senior Portfolio Manager, Wealth Advisor
Raymond James Ltd.
Phone: 519.883.6031
Unit 1 – 595 Parkside Drive | Waterloo, ON | N2L 0C7
david.cox@raymondjames.ca
www.financiallyinsync.com
![]() @DavidCoxRJ
@DavidCoxRJ
Disclaimer: Information in this article is from sources believed to be reliable, however, we cannot represent that it is accurate or complete. It is provided as a general source of information and should not be considered personal investment advice or solicitation to buy or sell securities. The views are those of the author, Financially INsync Team, and not necessarily those of Raymond James Ltd. Investors considering any investment should consult with their Investment Advisor to ensure that it is suitable for the investor’s circumstances and risk tolerance before making any investment decision. Statistics, factual data and other information are from sources believed to be reliable but accuracy cannot be guaranteed. It is furnished on the basis and understanding that Raymond James Ltd. is to be under no liability whatsoever in respect thereof. It is for information purposes only and is not to be construed as an offer or solicitation for the sale or purchase of securities.
Raymond James Ltd. is a Member Canadian Investor Protection Fund.
Raymond James (USA) Ltd. (RJLU) advisors may only conduct business with residents of the states and/or jurisdictions for which they are properly registered. Raymond James (USA) Ltd., member FINRA/SIPC.