Monthly INsync Chit Chat January 2024
Happy New Year! [by David Cox]
Some of you know that I’m a list maker and a routine/habit tracker, all of which makes the start of a calendar year a favourite time of mine as new goals are set, both personally and professionally, and a clean slate of sorts is created. In 2023, I managed to meet my goal of running more than 1,000 kilometres, which included a half marathon (I’m very glad that is over!). But in the coming year, I’d like to increase my commitment to weight training, which offers some balances to the cardiovascular side of fitness. And knowing how valuable it is for the body, mind and soul, getting out in the fresh air for a walk all 365 days in 2024 is my goal! I know, little room for flexibility on that, but seriously, even a 15-to-20-minute walk feels so good, I’m going for it!
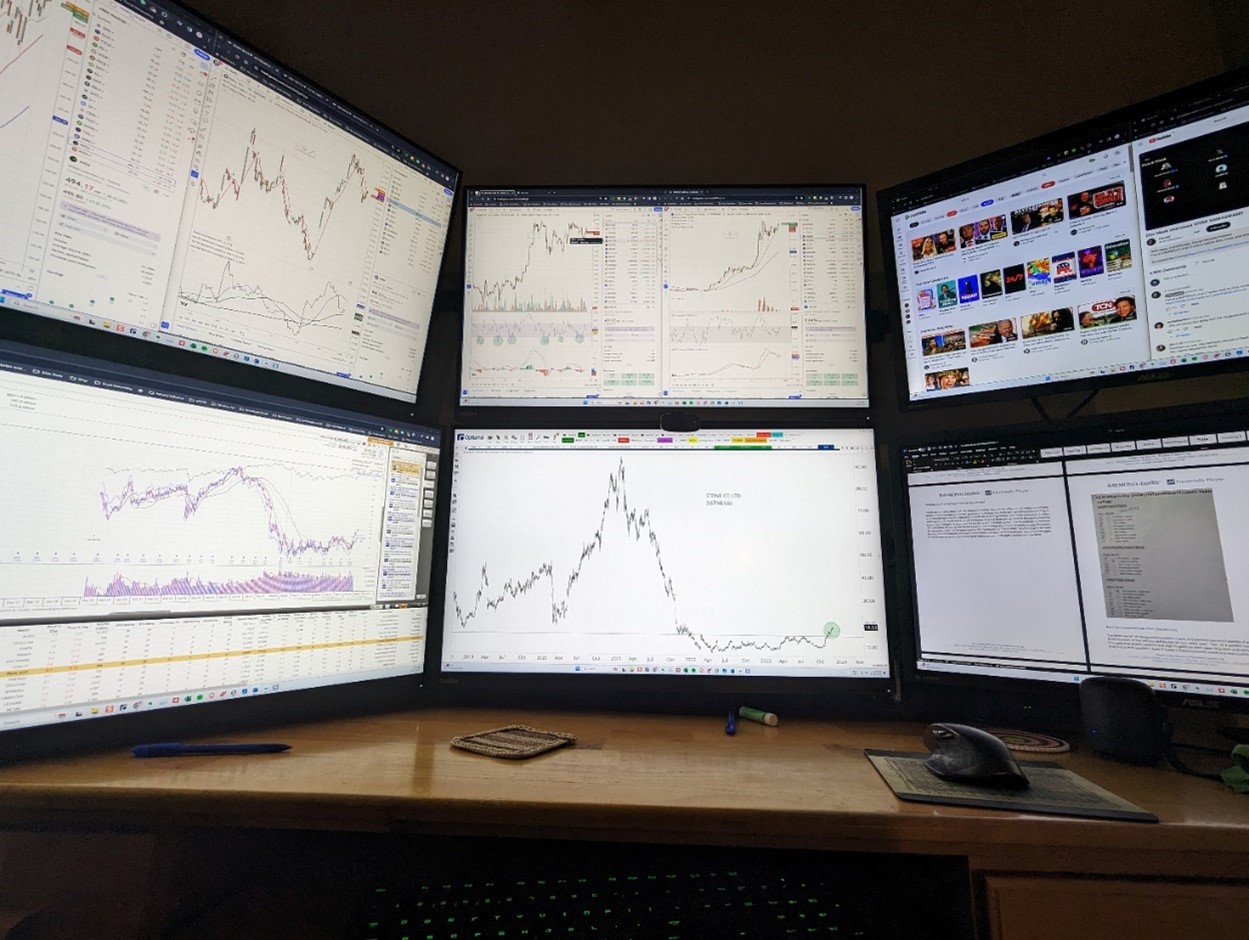
Both at home and the office, I’ve had three monitors on my desk for more years than I can remember. But I recently upgraded to a six-screen monitor set up at home with four 32” Lenovo P32p 4K monitors (the left 4) now flanking the two 28” monitors on the right. It really is comfortable and sort of like visual eye candy! To be able to dedicate screen real estate to charts (and more charts, and more charts) is bringing a bigger grin during my morning routine!
News –Some That You’ve Heard, Most That You Haven’t [by David Cox]
Global excess deaths continue: Canada has +16.7% growth in excess deaths (28,400) in the first 33 weeks of 2023 and U.K. excess deaths in 2022 + 2023 = 101,903 (far above the Height of the Blitz in 1940-1941), while the U.S. excess deaths in 2022 + 2023 = 651,512, more than 10x the number of U.S. soldiers who died during the Vietnam War (and yet global media silence continues). The U.S. is now borrowing money to pay the interest on the borrowed money, breaking new ground in its debt-based economy. Tucker Carlson, the former Fox News host, who was the most widely watched anchor nationwide, has resurfaced with his own “Tucker Carlson News Network” with a mission to share the truth about the things that matter (which tend to be things that the government-funded mainstream won’t cover). The Bank of Canada released its findings, which showed more than 80% of respondents (yes, I was one) were strongly opposed to a digital currency in Canada [they continue to further explore and develop engagement plans anyways]. The U.S. Department of Justice has withdrawn all campaign finance charges against Sam Bankman-Fried (the disgraced CEO of FTX, which bilked more than $10 billion dollars from investors in the largest Ponzi scheme ever) despite his $100 million donations to democratic causes. Henry Kissinger, war criminal beloved by America’s ruling class, finally dies. The new Argentinian president quickly removed 382 regulations in an effort to reduce government size and bureaucracy that has stymied growth and innovation.
Things We Recommend [by David Cox]
At a conference last year, I had someone show me their “Remarkable” (www.remarkable.com), a writing tablet for those of us note-takers. It is simple and doesn’t have any distractions like internet browsers, pop-ups, games or apps; it’s just for notes. It does sync to other devices like a desktop and/or phone, so those notes are always with you, but it writes and feels pretty much like pen on paper, and I took advantage of the Black Friday sale and bought one!
I don’t know about you, but I struggle with stacks of paper and notes, and notebooks in too many places than I can keep track of. I’ve tried tools like Evernote, but still lack the ability to bring my notes (and note-taking ability) consistently from home to office to conference and back again and Remarkable seems to offer just that. I’ve only used it for a few weeks, but it’s comfortable and whether it’s planning for the New Year, writing notes about some ideas I’m contemplating or even reading the many research-oriented PDFs, I like it. Highlighting and annotating those documents is useful and it allows me to seamlessly change the writing tip by varying the writing device, or thickness and erase just like the old days with the back of a pencil.
Lifestyles to Consider! [by Criselle Tung]
Christmas and New Year holidays are always full of gatherings and gift-giving, which also means a lot of scrumptious food! The indulgences were delightful, but now it's time to embrace a healthier routine. (I know how difficult this can be, especially during winter!)
Go back to the basics with a balanced diet and staying hydrated. Be mindful on your portions and have smart choices—savour flavours without overindulging. Incorporate vegetables, fruits, and lean meat in your meals.
Start small, like having a 15–20-minute daily walk (yes, I agree that David is on to something with his goal this year!). The power of compounding works not only in investing but also in building habits. Once you get the routine back, increasing the frequency and intensity level becomes more manageable.
Diversify your workouts to keep things fun and engaging. Explore your local community center for indoor sports; it's a great way to socialize too! Alternatively, opt for online workout videos if you prefer solitude or staying indoors—YouTube offers a variety. Remember, exercise also includes mind-body practices such as yoga or meditation. Numerous studios and online resources can guide you, benefitting your stress management, mental health, and the quality of your sleep.
Embark on the journey toward a healthier you, celebrating small steps, staying motivated, and making the post-holiday fitness routine positive and rewarding.
How’s the (Bigger Picture) Market? [by David Cox]
The stock markets have rebounded strongly from their correction lows this fall, and the S&P 500 (below) is sitting at about the same levels as the 2021 highs (both the Dow Jones Industrial Average & Nasdaq indices are above and in new high ground). Breadth has expanded in the stock market, as more stocks start to rise, with broader participation amongst sectors too, all against a backdrop of a short-term decline in interest rates (correcting some of their advance in recent years) and a falling U.S. dollar, which has tended to be inversely correlated to risk assets.
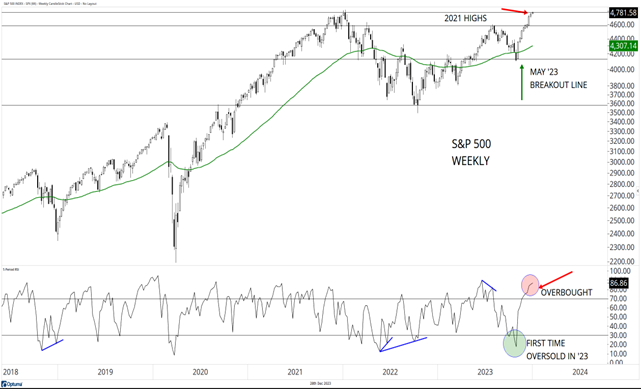
Source: Optuma
* * as at December 28th, 2023
Market Summary and Trend of “All Assets” [by David Cox]
Let’s dig into our usual “all asset” list and sort by 1-month return. Ethereum +17.4% and Bitcoin +16.7% lead the pack in the past month and Bitcoin leads all assets on a 2023 year-to-date basis (last column) with an impressive +163% surge (although it’s still -38% below the highs of its 2021 peak). The only trends that stand out here as being downwards are at the bottom and include U.S. dollar index $DXY and commodities (although not gold!). I’ve highlighted the S&P 500 and it’s interesting to see that it’s only managing to sit middle of the pack here this month as risk assets posted a strong month and finish to the year. A reminder that the short, intermediate and long-term trends are determined by the bullish or bearish condition of their respective moving averages (i.e., short-term is 8/20-period daily exponential moving averages and if 8EMA>20EMA, the short-term trend is positive/”True”/green).
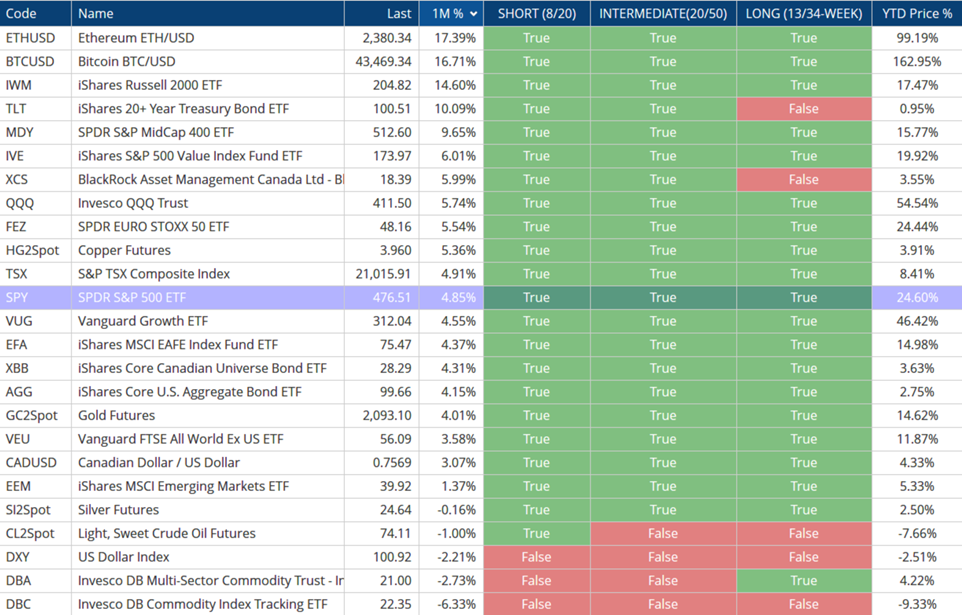
Source: Optuma
* * as at December 28th, 2023
We All Need to Keep Learning! – “Understanding Moving Averages” [by Conor White]
Moving averages are statistical calculations used to analyze data over a specific period, smoothing out fluctuations and highlighting the underlying trend. In the context of financial markets, two primary types of moving averages are widely employed: the Simple Moving Average (SMA) and the Exponential Moving Average (EMA).
Simple Moving Average (SMA): The SMA is a straightforward calculation that involves averaging a set number of data points over a specified period. For instance, a 50-day SMA considers the average closing prices of the last 50 days. This moving average provides a clear representation of the overall trend, making it particularly useful for identifying long-term market directions.
Exponential Moving Average (EMA): The EMA, on the other hand, gives more weight to recent prices, responding faster to current market conditions. Traders often prefer EMAs for short-term analysis, as they are more responsive to sudden price changes. The EMA is calculated using a formula that assigns greater significance to the most recent data points, reflecting the evolving nature of the market.
Practical Applications: Moving averages offer valuable insights into trend direction, support, and resistance levels. Here are a few practical applications of moving averages in technical analysis:
Trend Identification: By comparing the current price to its moving average, traders can discern the prevailing trend. An asset trading above its moving average may indicate an uptrend, while trading below may suggest a downtrend.
Crossovers: One of the most common strategies involves observing crossovers between short-term and long-term moving averages. A bullish signal occurs when the short-term average crosses above the long-term average, signalling a potential uptrend. Conversely, a bearish signal emerges when the short-term average crosses below the long-term average, suggesting a potential downtrend.
Support and Resistance: Moving averages can also serve as dynamic support and resistance levels. During an uptrend, the moving average may act as a support, while in a downtrend, it may act as resistance.
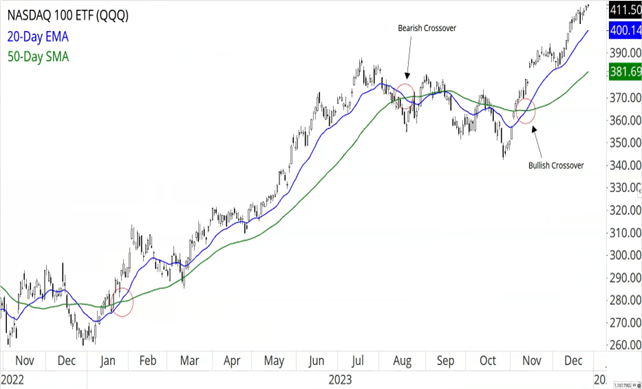
Source: Optuma
* * as at December 28th, 2023
Incorporating moving averages into your technical analysis toolkit can enhance your ability to navigate the complexities of financial markets. Whether you are a short-term trader or a long-term investor, understanding and utilizing moving averages can provide valuable insights and improve your decision-making process. As with any analytical tool, it's essential to combine moving averages with other indicators and risk management strategies for a comprehensive approach to market analysis.
Failing to Plan is Planning to Fail [by Criselle Tung]
And just like that, 2023 has come to an end. As we step into the new year, it’s essential to reflect on the past – what went well, what needs improvement, and what didn’t go as planned. Define some realistic and attainable goals for the year ahead, which may include establishing an emergency fund, paying off debts, saving for a major purchase, or investing for the future. Utilizing SMART (Specific, Measurable, Achievable, Relevant, Time-bound) goals provides direction for effective resource allocation.
Shift from vague goals like “save money” to specific targets such as “save $2,000 monthly in retirement accounts”. Being articulate not only provides clarity on your objectives but also establishes a measurable benchmark for success. Another key strategy is breaking down larger and long-term goals into smaller and short-term ones. Instead of “pay off debts”, try “pay off $500 monthly to student loans”. This approach makes the process less daunting, ensuring steady progress and helping you stay focused and on track.
Keep in mind that life is ever-changing, and so are your goals. Regularly review your goals and be flexible to adjust as circumstances evolve, whether due to change in income, unexpected expenses and/or priority changes. Finally, celebrate your achievements along the way! Acknowledge the milestones, no matter how big or small. This positive reinforcement not only boosts morale but also reinforces the habits leading to financial success. Here's to a purposeful and successful year ahead!
This Month in Innovation [by Conor White]
Google announced Gemini, its most powerful suite of AI models yet, and the company has already been accused of lying about its performance.
FDA Approves First Gene Therapies to Treat Patients with Sickle Cell Disease.
A collaboration between researchers from Cornell and University of Alberta, Edmonton, has created a new technique to treat Type 1 diabetes: implanting a device inside a pocket under the skin that can secrete insulin while avoiding the immunosuppression that typically stymies management of the disease.
One UPtrend, One DOWNtrend [by David Cox]
As you know, we believe strongly that trends are important to understand because as I always say, if you want your portfolio to rise, it really is sensible to own stocks and securities that are rising! The more securities in your portfolio that are trending downwards, the harder it is to make upward progress. The “back of the room test” is putting a plot before you, like the one below, and figuring out if you can tell if it’s an uptrend or a downtrend when standing at the back of the room.
This month, let’s look at two 8-year charts. In the top, we have Cintas (CTAS:US), a company whose white trucks you might have seen driving around your town, delivering employee uniforms to a nearby business. They have more than one million clients worldwide! It’s a $61 billion dollar company, and it came to market as an initial public offering in 1983. Looking at the chart below, and aside from the 2020 selloff (COVID), it’s clear to say that it’s in an uptrend!
As a counter example, we see Pfizer (PFE:US), a $162.5 billion mega-cap drug company. Can you see the uptrend from 2015 to 2018? Then the short-term uptrend from COVID lows to late 2021? Since then, it’s been in a downtrend and the stock recently traded lower than in 2020 (lower lows is part of the definition of a downtrend). Anyways, we could debate a few spots on the chart, but I think you’ll agree that is does look starkly different than Cintas.
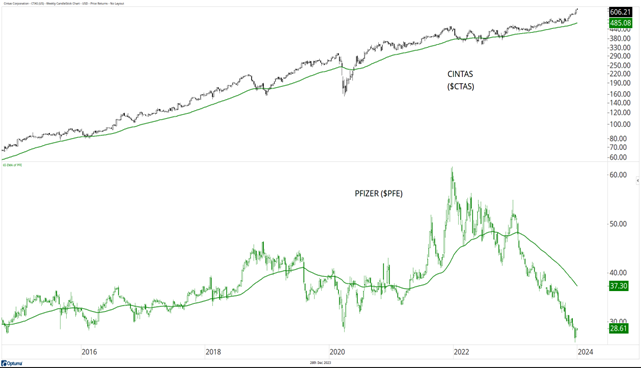
Source: Optuma
* * as at December 28th, 2023
Sharing Our Tools of the Trade [by David Cox]
We certainly spend some money on research and tools that we use in the pursuit of our investment activities and due diligence, and one of the sites that we subscribe to is HedgeMind (www.hedgemind.com). The site aggregates all the filing data from institutional investors and hedge funds, and can provide insights into where the big money investors are putting their dollars. Do you think Warren Buffett is a great investor? Stanley Druckenmiller? Cathie Wood?
It can be fascinating to look into what stocks these investors are buying and adding to, and which stocks they’re selling and/ or trimming. As individual investors, we have tremendous flexibility that the large institutional investors quite simply do not have. You see, those that manage billions of dollars have to buy and sell a lot of shares to impact their portfolios and it can take them weeks to months to acquire a stake, during which time the price can move significantly.
One of the tools allows us to compare our own timing for a given stock against an institutional manager and in this example, we’re looking at StoneCo and Warren Buffett who made headlines years ago when he announced he had taken a stake. Below, we can see that Warren Buffett bought into StoneCo on 12/31/2018 and his return is +43% since initial purchase. Some of our clients purchased it last month, on November 13th, 2023, and our open gain is +53%.
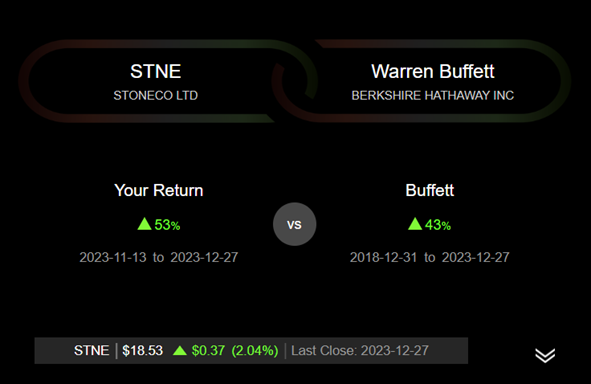
Source: Hedgemind
* * as at December 27th, 2023
By looking at the track records of the strongest managers, we can learn of their styles, their position sizes and see a glimpse of their timing and portfolio management process. It’s kind of neat, and when a new stock hits our radar for one reason or another, I like to take a quick look at HedgeMind and see who’s involved!
We Like Fundamentals Too! [by David Cox]
Let’s shine some more light on Stoneco (STNE:US) that we discussed above, in the same breath as Warren Buffett. It’s a New-York listed, Brazilian company that provides financial technology solutions to merchants. This company made headlines years ago when Warren Buffett disclosed his ownership. This is a $5.8 billion company and they’ve been posting some very solid sales growth in the past few years. If you look at the growth in earnings per share (EPS), you can see that the most recent September ’23 quarter had EPS of $0.26/share compared with $.06 a year earlier. Can that continue? Not over the longer term, because at +306% it would overtake the world, but the point is the company appears to be in the early phases of growing their business and starting to make some money in doing so.
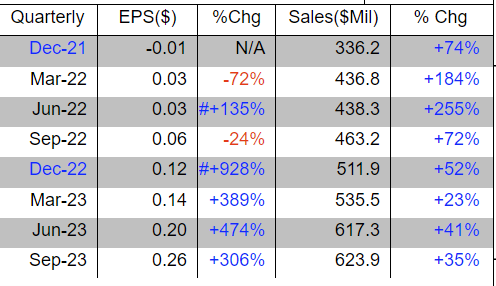
Source: Marketsmith
* * as at December 28th, 2023
Another fundamental, at least to us technicians, is the ratio of upside vs. downside volume, a way of measuring who is stronger, the buyers or the sellers? $STNE has an U/D volume of 4.1, which is very high! The forward price earnings (P/E) ratio is only 14, which doesn’t look very expensive at this juncture and in the last 5-years it’s traded with a range for the P/E ratio of 17-174. As you can see by the stock chart, it came down a long way from its early 2021 highs but recently broke out of an almost two-year base (green circle).
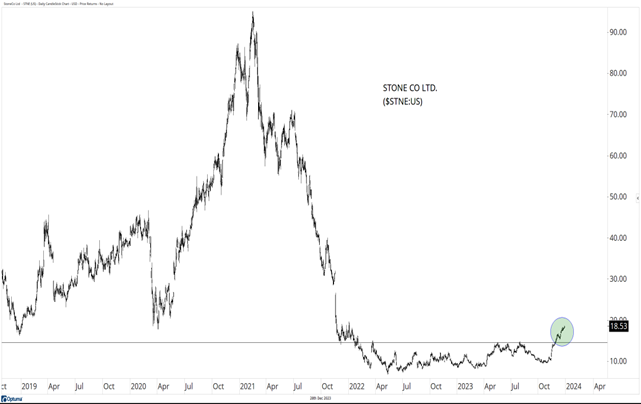
Source: Optuma
* * as at December 28th, 2023
Chart of the Month [by David Cox]
There has been a lot of improvement in the market this fall and it’s suggestive of increasingly bullish conditions as we turn the calendar year into 2024. The chart of the month shows us the % of stocks that are less than -20% from their highs. The closer a stock is to 52-week highs, the better (and a lot better than stocks near 52-week lows!), and we can see here that on all stock sizes, i.e., large-cap, mid-cap and small-cap, we’re seeing the highest levels reached for stocks within -20% of their highs in two-years going back to the end of 2021. That’s great news and very constructive in my opinion. There are lots of ways of understanding market breadth, but to understand a market, we have to understand its underlying components, and, in this case, we can aggregate its behaviour by looking at groups of stocks to see how they’re doing.
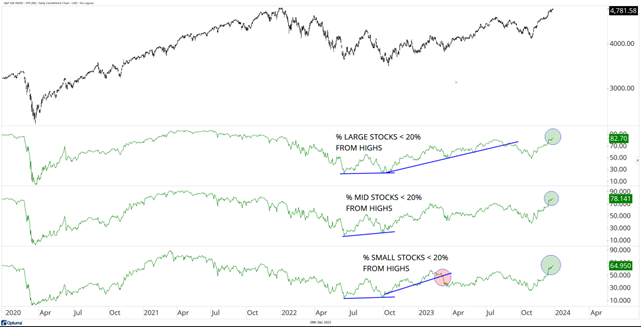
Source: Optuma
* * as at December 28th, 2023
Social Media and Our Website [by David Cox]
Some of you have ventured out into the social media landscape far enough to find twitter. And those that didn’t (or haven’t), not to worry, “twitter” is gone, it’s now called “X”. I can regularly be found providing observations and charts that allow us investors to gain perspective about the environment and dialogue about it! It can be fun to engage with questions and comments, and I’d encourage you to take a peek in the coming year if you haven’t already. You can find and follow me at @DavidCoxRJ. You can also follow Don @DDaggettRJ and Conor @ConorWhiteRJ.
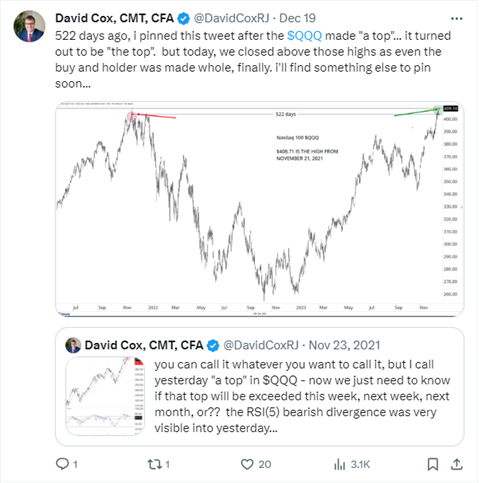
On November 23, 2021, the day after the Nasdaq peaked, I had tweeted out the daily chart and called it a peak (below), which of course had received its fair share of criticism at the time. Some people get angry when an observation or opinion doesn’t match their own and this tends to be more commonplace at both tops and bottoms. In truth, all it was, was my observation that an outside day after a big rally showed the character change of supply suddenly outstripping demand, which from my experience was a peak! Well, I followed up that tweet in the past month as the Nasdaq exceeded those highs after 522 days! Game on!
Upcoming Dates, Seminars, and Announcements [by David Cox]
What: CMT Association & Investopedia
Where: https://www.investopedia.com/chart-advisor-newsletter-opt-in-right-rail-7095828
When: We’re providing the daily report for the week of January 22-26th, 2024
What: CMT Association Annual Symposium
Where: Dubai, UAE
When: February 28th – March 1st, 2024
Who: I will be in attendance and excited to visit a new part of the world!
What: Raymond James Portfolio Management Conference
Where: Calgary, AB
When: April 8-10th, 2024
Who: I expect to attend…
What: Bitcoin 2024 Conference
Where: Nashville, TN
When: July 25th-27th, 2024
Who: I’m very excited to check out this growing event!
Wishing you a happy, healthy and prosperous 2024 year ahead!
Sincerely,
David Cox, CFA, CMT, FMA, FCSI, BMath
Senior Portfolio Manager, Wealth Advisor
Raymond James Ltd.
Phone: 519.883.6031
Unit 1 – 595 Parkside Drive | Waterloo, ON | N2L 0C7
david.cox@raymondjames.ca
www.financiallyinsync.com
![]() @DavidCoxRJ
@DavidCoxRJ
Disclaimer: Information in this article is from sources believed to be reliable, however, we cannot represent that it is accurate or complete. It is provided as a general source of information and should not be considered personal investment advice or solicitation to buy or sell securities. The views are those of the author, Financially INsync Team, and not necessarily those of Raymond James Ltd. Investors considering any investment should consult with their Investment Advisor to ensure that it is suitable for the investor’s circumstances and risk tolerance before making any investment decision. Statistics, factual data and other information are from sources believed to be reliable but accuracy cannot be guaranteed. It is furnished on the basis and understanding that Raymond James Ltd. is to be under no liability whatsoever in respect thereof. It is for information purposes only and is not to be construed as an offer or solicitation for the sale or purchase of securities.
Raymond James Ltd. is a Member Canadian Investor Protection Fund.
Raymond James (USA) Ltd. (RJLU) advisors may only conduct business with residents of the states and/or jurisdictions for which they are properly registered. Raymond James (USA) Ltd., member FINRA/SIPC.