Quarterly Strategic Review - 4th Quarter (Oct-Dec, 2023)
RISK TAKING PAYS OFF AFTER A CORRECTION
Last quarter, I wrote about how corrections are tricky and can wear us down as investors, particularly if you’re someone paying close attention to your portfolio values (which I really would discourage!). Not because you shouldn’t know where you stand financially, but because knowing where you stand financially every week, or even every day, can actually be unhealthy! We, of course, strive to ensure that all of you know that we’re always working hard to navigate changing and volatile conditions.
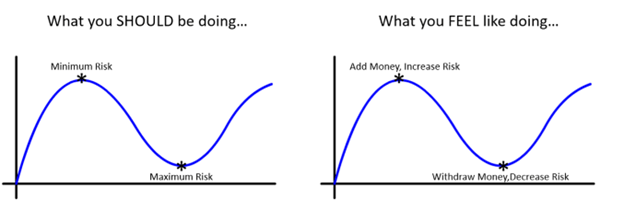
Like I discussed last quarter, the most aggressive investors can typically expect to “draw down” (a draw down, in investor parlance, is thinking about how much % your portfolio falls from a prior high value) more than conservative investors, even though the management of risk is still applied in all circumstances. And once that stretched elastic band, that is the oversold stock market I refer to, starts to bounce back, it’s the investors with the most risk on the table at the bottom that reap the biggest gains. In a perfect world, one could take maximum risk at the ultimate low and minimum risk at the ultimate high. That, of course, isn’t practical, although that is what we do at the edges in your portfolio whenever necessary.
I’m comfortable telling you I can spot a high in the market when it’s happening, but I never know if it’s a short-term (i.e., a day or two, or even a week) peak, or something bigger picture (i.e., a multi-year top, like the fall of 2021). But I will say that is precisely why we take risk off (meaning we reduce risk by trimming positions and/or taking some profits/cutting some losses) in client portfolios any time “a peak” happens. Because I never know when “a peak” will end up being “the peak” and I know from experience it’s a lot more fruitful to act quickly before the damage becomes significant. The vice versa is also true. We add risk/equity/exposure when the market makes “a low”, because I never know if it’s going to be “the low”, just like on Thursday, October 13, 2021. In hindsight, the evidence usually prevents investors from becoming negative enough to take action at a bull market high, and the headlines and narratives are usually dire enough to prevent a willingness to take more risk at the bear market low. But it’s where the best value and risk/reward set ups are.
THE CONSENSUS HAS CHANGED
Interest rates rose a bunch, and now that they’ve gone back down some, investors and the market are suddenly willing to start assuming cuts and more cuts are ahead in North America. Those highly indebted folks, especially the ones in Canada with big mortgages, are hoping for them to keep falling. But is it realistic?
I have to, again, point out, that at this juncture, I really don’t find myself looking at the context, the environment, the indebtedness and the chart itself as suggesting the era (been way too little time) of higher interest rates is over, in my view. Interest rates went down for 40+ years, and they rose a bunch in the past few years. But, do they suddenly need to keep falling down to the absurd levels towards zero again? No. I’ve seen a couple of videos recently that demonstrate how out of whack the Canadian real estate market got in terms of affordability and in the related ratios of price to income. It made no sense, I said that for years, and I still think it’s wildly far from reality. I know, not the news some want, but I don’t consider it my job to offer up an opinion that matches what a reader wants to hear. I’d rather try to offer objective insights and utilize my experience, my understanding and the study of intermarket analysis to put together the jigsaw of how all the interworkings function, and to gain an expectation of what it could mean, and then what could be done about it from an investment standpoint; whether that means protecting capital in a bubble, or taking advantage of trends that can ignite as the winds of change blow through government, industry and sectors, creating new opportunities and challenges. Innovation has to happen and will continually re-shape tools and ways that we’ve been used to.
Investors in Kodak, Blackberry and Nortel all lost their shirts, and in some cases, their fortunes. Be thankful we use stock charts, which guide the way and show us when the market peaks and when up trends come to an end, because as I already said, there is more value in reducing risk close to what turns out to be the top when compared with those that decide they must reduce risk after the pain and regret of loss has grown too painfully.
THE YEAR IN REVIEW
This year 2023 is behind us and, no doubt about it, investors weren’t positive enough coming into the year, and still weren’t as the second quarter started. As is unfortunately typical, but the time many investors increased risk, the three-month correction arrived (August-October), which was enough to turn everyone negative again, before the strong finish to the year. Emotions get in the way of investing for sure! Charts help!
We’ve made a number of recent changes that some of you might have noticed. In an effort to better utilize and take advantage of the high rate of interest available, we’re striving to operate with using money market/ETFs to replace securities that are sold in your portfolios. You may have noticed some iShares Floating Rate Bond ($FLOT:US), iShares DEX Floating Rate Bond ($XFR:TSX) or some Purpose High Interest Savings (PSA:TSX). For clients with a 100% equity mandate (i.e., Aggressive & Long-Term Growth), these vehicles are mainly placeholders until reinvestment. But for those with fixed income representing a portion of your overall account structure, these can also be used as fixed income alternatives without any type of term commitment, and yet, attractive rates today.
As some of you know, we said that we had made some significant changes in decision making, particularly as it relates to large-cap trend following, compared with how we used to operate before we moved to Raymond James. Notably, we’ve zoomed out on our charts, and so, not only are we looking to acquire stocks that have outperformed the S&P 500 on a 1, 2, 3, 4, 5, and 10-year time frame (which in and of itself is a recipe for strong relative performance), but we’ve allowed these stocks more room to fluctuate in the short term, given the context of the bigger picture uptrend. This has led to less activity across the board and, having recently reviewed most of the realized gain/loss reports for upcoming tax purposes, it was quite clear that the reports are shorter and cleaner. In fact, there are some of you who, despite having a solid year in your taxable accounts (i.e., we made great money!), have net losses to realize for 2023. This evidence of selling the weak, losing positions and being more patient and holding the strong stocks with more conviction is taking shape and I think it’s a very positive change, and I do hope you agree.
HOW WE’RE ALLOCATED
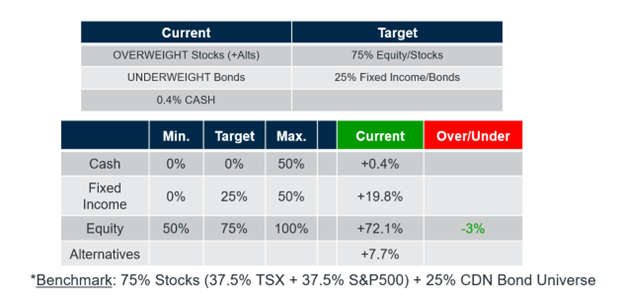
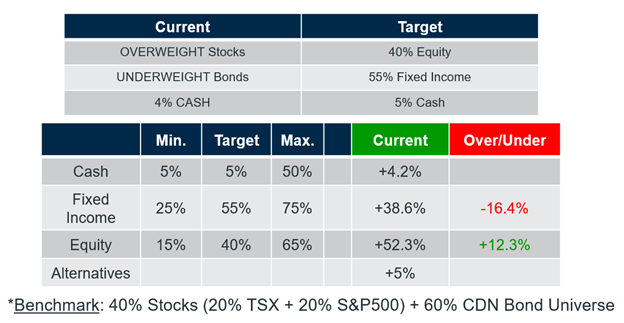
As you hopefully realize, these days, all clients’ accounts are being managed according to a set “risk bucket” that has been determined based on our discussions, your experience and commensurate with your ability and willingness to take risk. The current allocations for clients in each of the buckets that contain fixed income are shown below. As should be expected, after a correction ends and stocks re-assert themselves to the upside, we increase equity exposure commensurately and if you compared these tables to last quarter, you’d see the higher exposure to both equities and fixed income for the most part.
Compared with the prior quarter, we did increase our fixed income exposure marginally, but continue to see greater opportunities with equities. Given the pullback in interest rates, in the still assumed bigger-picture uptrend, I remain unconvinced that it makes sense to be overly yield seeking, particularly when the equity market, fueled by further money printing and central bank backstopping, seems likely to continue indefinitely as debt spirals away on both sides of the border, and throughout the world.
“BALANCED” RISK BUCKET
Source: Croesus
As at January 19, 2024
“CAPITAL PRESERVATION” RISK BUCKET
Source: Croesus
As at January 19, 2024
“BALANCED/LONG-TERM GROWTH” RISK BUCKET
Source: Croesus
As at January 19, 2024
OUR RISK BENCHMARKS
In the following table, we can compare the returns of the benchmarks of our various risk buckets (your individual account performance is found on RJ online each quarter).
The market bounced back strongly (and we bounced back even more so!). The benchmarks are sorted by the 3-month % change for the 4th quarter to December 31st, 2023. As a reminder, for equities, we use a 50/50 blended benchmark which includes 50% of the return of the S&P/TSX Composite (Canadian stocks) and 50% of the return of the S&P 500 (U.S. stocks) both in Canadian dollars.
Just like I described above, while the aggressive clients (always includes me here!) had larger drawdowns, the recovery to new highs was much stronger as the market came back to life in November and December.
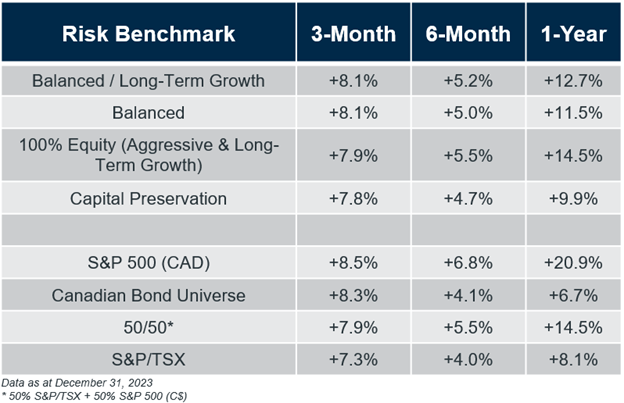
Source: S&P/TSX & S&P 500 price data from Croesus
OUR STRATEGIES
ETF INfocus (formerly named “ETF 6/16”)
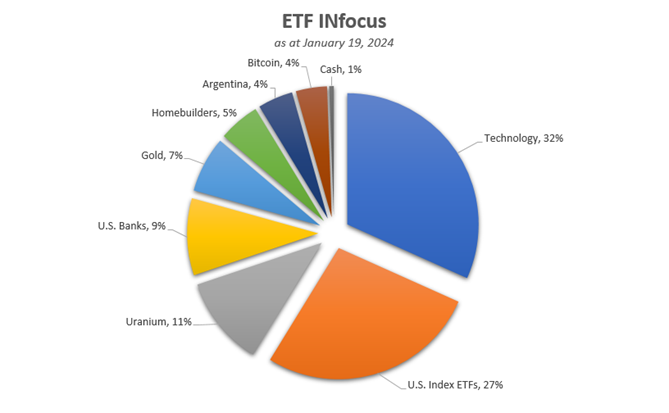
One of the things we’ve always prided ourselves on is risk management and the most common way to define risk in a portfolio is volatility, i.e., the up and down of price movements. By managing risk, i.e., taking some profits and cutting losses, when and as necessary, we strive to produce an outcome with less risk than the markets.
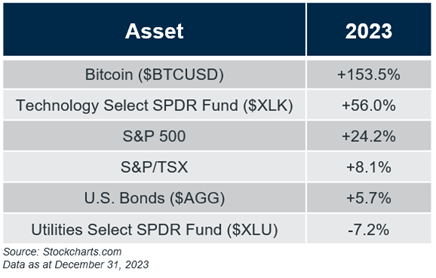
In the pie chart below, you can see our overall exposure at the model level. We continue to be unexposed to the Toronto market, which makes sense with the continued underperformance. Uranium remains an important position and it’s our Bitcoin position that really added value in 2023, with the price of Bitcoin having risen +160%. We’ve been a recent buyer of U.S. banks, which have not only reclaimed the March ’23 break down levels during the bank collapses, but also are back to showing a pattern of higher highs and higher lows, not to mention doing so with S&P 500 relative outperformance too. We’ll see if it develops further.
Source: Croesus
As at January 19, 2024
The most consistent area for the 4th quarter (and for all of 2023) has been our technology exposure which continues to be gained through a variety of broad based technology sector ETF positioning, along with cyber-security ($HACK/$CIBR:TSX), semiconductors ($SMH) and other growth type areas like the Bitwise Crypto ($BITQ) that we’ve had. Our gold position continues to reside, broadly, in most client portfolios and, while it hasn’t exactly surged onward from that $2,000 U.S. level, it certainly looks like it could very well happen at some point. And until then, we’ll take the diversifying nature and overall opportunity for risk management by holding some.
TrendINsync (formerly named “Equity INtrend”)
Our “Financially INsync” universe, which is rebalanced once each quarter, now has 156 stocks in it for the quarter ended December 31. As a reminder, these stocks have been screened, as at quarter-end, and have demonstrated returns greater than the S&P 500 for each of the 1, 2, 3, 4, 5, and 10-year time frames.
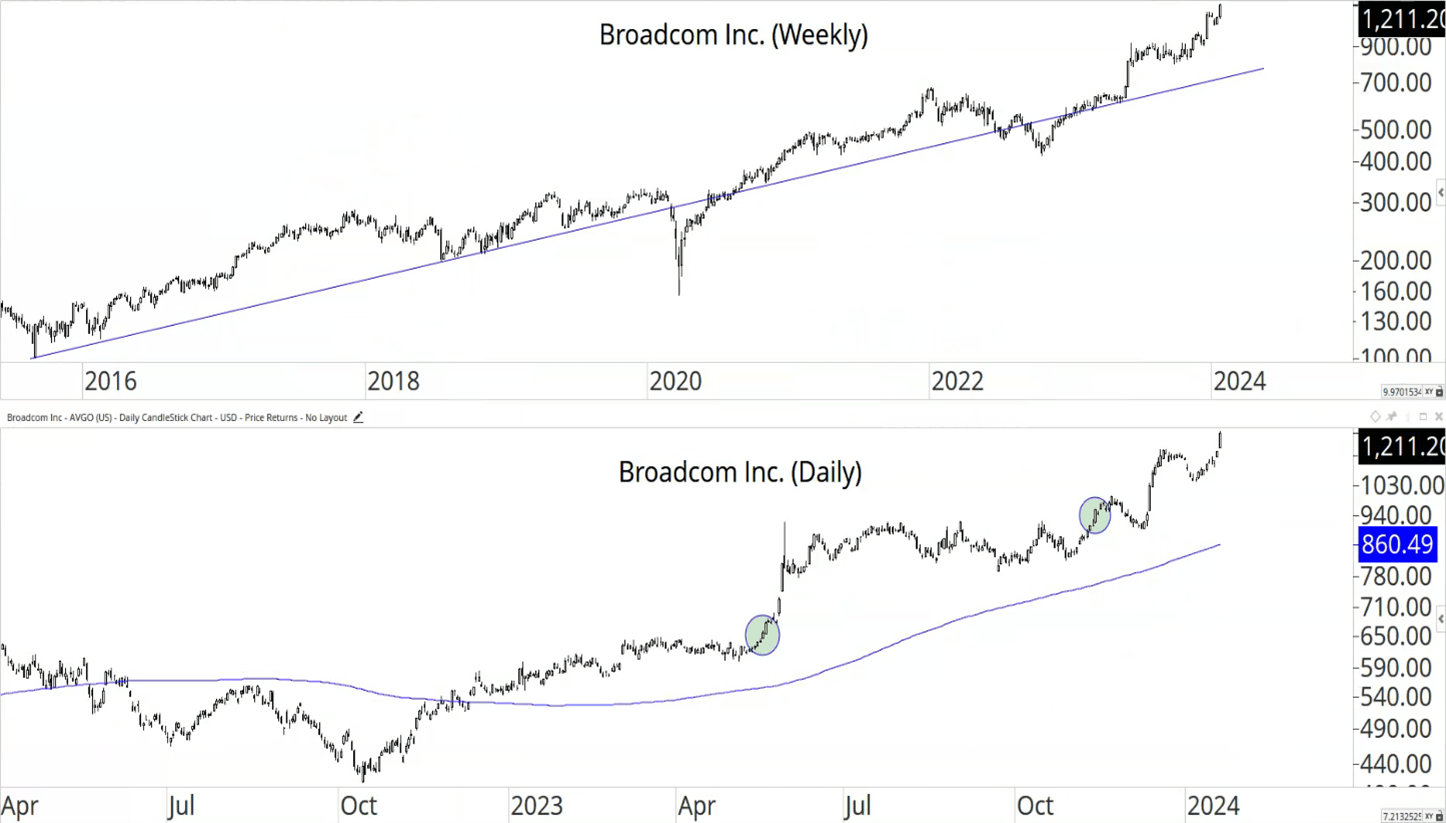
Given the stringent screening criteria, the long-term charts are all essentially in long-term uptrends by design. This quarter, let’s look at Broadcom (or what I still call Avago – back to their pre-merger days), which trades under the ticker $AVGO. It’s a designer of integrated circuits (semiconductor chips) for the telecom, industrial, automotive and computing markets. It’s a mammoth $572 billion dollar company.
Below, the top panel shows the 7-8 year weekly chart in its clear uptrend (save for temporary, short-term COVID selloff interruption). In the bottom panel, we have our initial buy point and then the follow-on buy point this past quarter, when the stock broke out of a sideways range. It’s been rising (strongly!) ever since. As a reminder, you likely have heard me talk about the semiconductors and the strength of that industry group within technology for some time and we do own a number of Avago’s peers too. And I always like to say that it’s more ideal if we have the whole sector and/or group moving in unison (i.e., strongly in this case) rather than the stock being a lone mover (which it most certainly has not been).
As usual, if you were to ask me how high this stock could go, I’d have no clue and wouldn’t even hazard a guess, but I did point out this morning on Twitter that the semiconductor stocks (as a group) have been outperforming the S&P 500 for 16-years running, dating all the way back to 2008! Now, THAT is what we call RELATIVE STRENGTH!
Source: Optuma
As at January 19th, 2024
Our largest and most widely held positions from the INsync universe with our initial cost bases since introduction into portfolios include the following:
Eli Lilly (health – drugs): +94.9%
Dollarama (consumer staples – retail): +22.4%
Cintas Corporation (industrial – uniforms): +36.1%
Broadcom (technology – semiconductors): +87.9%
Synopsys (technology – semiconductors): +34.6%
INvertigo
The higher risk, faster moving INvertigo type stocks behaved very well in the 4th quarter, as the correction ended and more and more growth areas came to life, exploding out of bases with volume in many examples. Many of the real “growth” stocks in this market peaked out back in early 2021 and were crushed, with some early movers having been uptrending for some time, but others, still trying to get going, only now.
Currently, aggressive clients are sitting with approximately 30% exposure to INvertigo type stocks, which is a big increase from the end of September. That makes sense though, because that was after and in the midst of a multi-month correction in the broader markets. Long-term growth clients have about 10-11% exposure on average, and always carry a much lesser risk profile compared to aggressive clients.
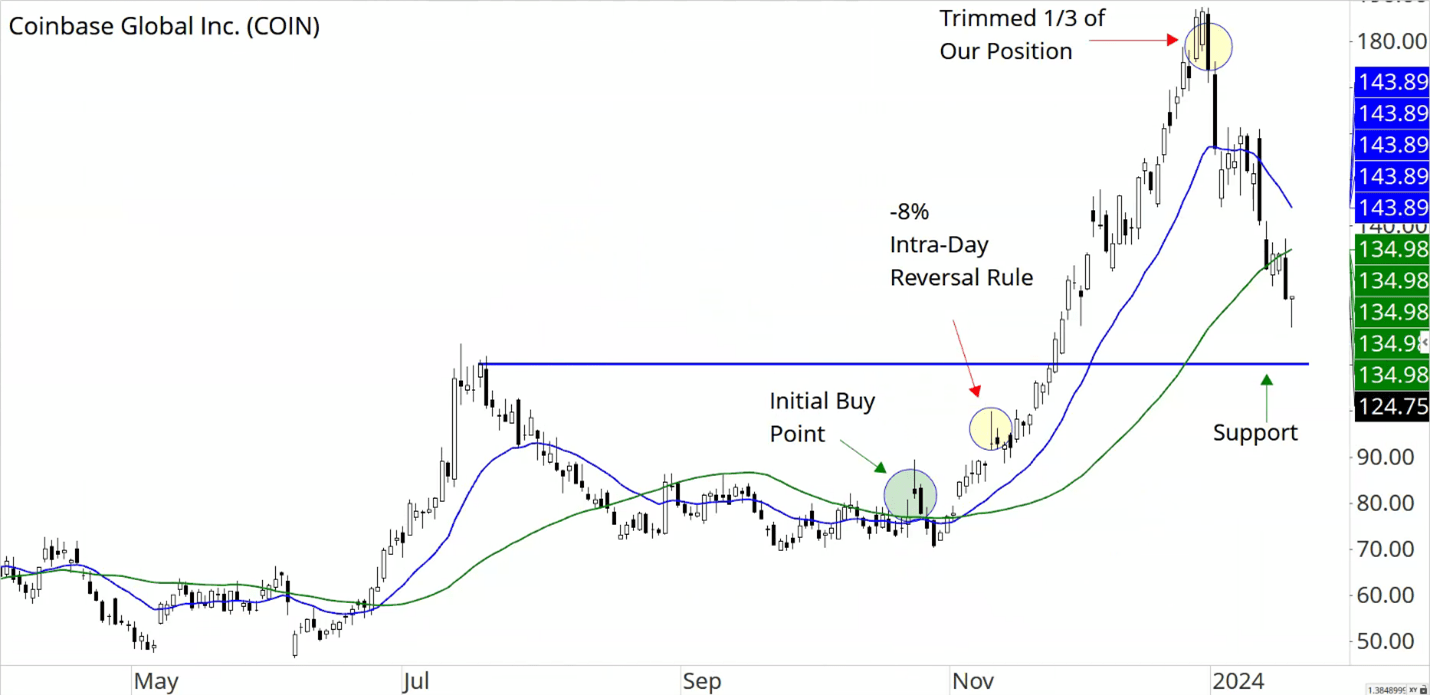
Coinbase ($COIN) is one of the stocks tied indirectly to the cryptocurrency space and was recently chosen as the custodian for most of the new U.S.-based Bitcoin ETFs that were approved. It has a market capitalization of $30 billion right now and popped back up after a consolidation in late October (green circle) where we bought in. As I had shown on the webinar a week later, it had a supply concerning -8% reversal (meaning the stock closed -8% below the high of the trading day) and that is a rule for us to trim the stock, which we did. Then, it soared (yes, that means, in hindsight, our first trim was fruitless!) and we trimmed 1/3 of the positions into very overbought conditions, which has now turned out to mark an important high. The stock has pulled back all the way back to the ~$125 level today (after peaking at $187), so you can see that it’s a volatile stock! It still remains above the summer ’23 breakout (horizontal line) levels. We are holding, and we’ll see if the stock can get going again. Remember, this a daily chart and the swings look much greater, than on the weekly chart.
Source: Optuma
As at January 19, 2024
NOTES FROM THE “FINANCIALLY INsync” TEAM
The 4th quarter performance reporting was released, along with the short version of the quarterly comments. This longer and more detailed piece is designed to provide further insights into the investment management process and the securities that make up your individual accounts. If you have questions, please do not hesitate to contact us, at any time!
If you’ve read this far, thanks for doing so! Did you find it useful? Your feedback is always appreciated and thanks in advance!
David Cox, CFA, CMT, FMA, FCSI, BMath
Senior Portfolio Manager, Wealth Advisor
Raymond James Ltd.
Phone: 519.883.6031
Unit 1 – 595 Parkside Drive | Waterloo, ON | N2L 0C7
david.cox@raymondjames.ca
www.financiallyinsync.com
![]() @DavidCoxRJ
@DavidCoxRJ